Rethinking Condition Monitoring Strategies for Today's Turbine Oils
Turbine oils have had a fairly boring history over the last century. There are only a few documented cases in scientific literature of problems with turbine oils throughout the 1900s. Similarly, monitoring the life of these fluids was accomplished by employing long-established laboratory tests that provide early warning signals that allow maintenance personnel time to take proactive actions prior to a negative impact on their plant's operational reliability. If it was only that simple now. Things have changed dramatically over the last couple of decades. Modern turbine oils are formulated differently than their cousins of the recent past, starting with a switch from Group I to Group II (and beyond) basestocks coupled with the incorporation of more complex and effective antioxidant chemistries. Reliance on antiquated analytical techniques has caught many users off guard as these tests are no longer the predictive tool that they once were. The time has come to rethink how we monitor mineral-based turbine oils.
| Model | Lubricant Reservoir Residence Time (mins) | Highest Bearing Temperature (F) | Typical Bulk Oil Reservoir Temperature (F) |
|---|---|---|---|
| Class E | 5.8 | >500 | ~135 |
| Class F | 7.4 | <250 | ~135 |
New Formulation Technologies
Before rethinking turbine oil condition monitoring strategies, it is important to know what has changed in turbine oil formulations as well as the reasons for the changes. If you haven't guessed by now, most turbine oil formulations on the market and in use today are quite different than those in the recent past. Today's turbine oils are required to perform more functions in increasingly harsh environments. In some of the more unforgiving scenarios, the same reservoir of fluid simultaneously provides lubrication to the turbine bearings, generator bearings, atomizing air compressors, lift oil system, trip oil system, the generator hydrogen seal system, load gears and a multiplicity of servo valves within the hydraulic circuit.
There have been many driving factors contributing to these oil formulation changes. The three most influential factors on turbine oil formulations have been increasing demands by OEMs, upgraded lubricant refining technologies, and an effort to reformulate for enhanced differentiation and value proposition.
OEM Influence
Gas turbines are the most demanding application for turbine oils, which also has been the fastest-growing market in the United States for power generation. In 1998, 15 percent of U.S. electrical power was provided by gas turbines. In 2020, gas turbines are projected to provide 39 percent of the nation's electricity. The efficiency and firing temperature of gas turbines is continually rising as more advanced metallurgies are developed. In general, the stress on the turbine oil also increases with more efficient engines, and most turbine OEMs are demanding increased turbine oil performance. Since the country's first power generation gas turbine was installed in Oklahoma in 1949, there has been a general consensus that an increase in firing temperature causes an increase in bearing temperature, thus creating increased lubricant stress. Some of the factors that determine how quickly turbine oil degrades are summarized in Figure 1.
The stress on turbine oils, however, may be more complex than just looking at the lubricant's residence time, high-temperature zones and reservoir temperatures. Figure 1 suggests that the "Class E" system may impart more stress on its turbine oil when compared to the "Class F" system. In reality, turbine oils lubricating Class F units typically degrade faster and have more performance challenges. Additional factors to consider when assessing the stresses on the turbine oil in a system include the environmental conditions of where the unit is located, its duty cycle and the plant's maintenance practices. In this particular example, Class F units are known to exert further stress on the turbine oil due to a phenomenon known as spark discharge, which occurs in the unit's main lube oil filters.
Reformulating Turbine Oils to Enhance Value Proposition
Oil manufacturers have brought significantly more refining capacities online to produce higher-refined basestocks, making Group II and III basestocks widely available. Today, most turbine oils formulated in North America are now built with a Group II basestock. The shift from Group I oils to Group II and III oils also has resulted in a significant change in formulation strategies. Certain antioxidants are able to greatly enhance the oxidative stability of Group II and III turbine oils as measured by the rotating pressure vessel oxidation test (ASTM D2272-RPVOT) and turbine oxidation stability test (ASTM D943). As a result, newer turbine oils have much higher oxidation stability values compared to older formulations.
Some oil manufacturers began using RPVOT values as a key selling feature to further differentiate their turbine oils by attempting to correlate the high performance of their turbine oil's oxidation tests to real-world applications. End-users welcomed differentiating values on oil specification sheets since virtually all of the other specifications are extremely similar. Many turbine oils over the last decade have been selected based solely on RPVOT values.

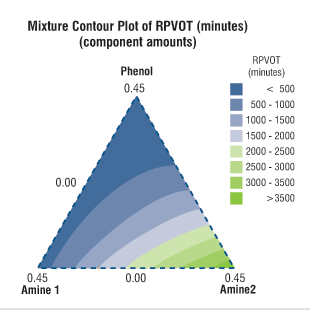
An example of the influences antioxidants can have on RPVOT values can be seen in Figure 2, based on research by Albemarle Corporation.
In Figure 2, you can see that Amine 2 has a very positive influence on RPVOT values, exceeding 3,500 minutes at a concentration of 0.45 percent by weight. The phenolic antioxidant, however, produced RPVOT results of less than 500 minutes at the same concentration. When the phenol and Amine 2 additive are blended in at equal concentrations (0.225 percent by weight each), the RPVOT value is less than 1,000, demonstrating the potential negative influence that phenols can have on RPVOT values. This is one influential factor why amines have been the antioxidant of choice in many of today's turbine oil formulations.
It is now accepted in the power generation industry that beyond a certain point, RPVOT values do not directly relate to field performance. This is evident for several reasons:
- Some of the antioxidants that generate very high RPVOT values also produce high levels of insolubles upon depletion and show direct correlation to the formation of sludge and varnish within the lubricating circuit. To this end, the use of some antioxidant chemistries that contribute to very high RPVOT values has been a contributing cause to the increase in varnish problems in gas and steam turbines. Clearly, there is not a relationship between initial RPVOT values and field performance.
- RPVOT values can be strongly infl uenced by the addition of some corrosion inhibitors and metal pacifiers. These additive species can negate the effects of the primary catalyst in the RPVOT test, a copper wire coil, improving the test results and giving a false indication of the fl uid's antioxidant properties. Corrosion inhibitors typically deplete out of turbine oils fairly quickly once put in service as they are polar and designed to provide a protective film to metal surfaces. It is not unusual in some turbine oil formulations to see a sharp drop in RPVOT values during the fi rst year of service as a result of corrosion inhibitor depletion. RPVOT retention is a much stronger indicator of turbine oil performance than initial RPVOT results.
- The RPVOT test has very low reproducibility for oils above 1,000 minutes and is not a recommended test by ASTM for these formulations. Most commercially available turbine oils now boast initial RPVOT values above, and in some cases well above, 1,000 minutes.
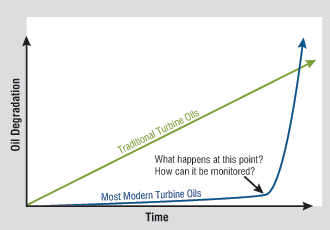
New-generation turbine oils degrade differently than traditionally formulated lubricants. The non-linear degradation of most modern turbine oils can be attributed to the specific antioxidant(s) employed, as well as the low natural oxidative resistance characteristics of Group II and Group III basestocks. As a result, the majority of standard oil analysis tests provide little to no warning as to when the lubricant will start to degrade and generate system deposits. Instead of degradation occurring in a linear and predictable fashion, many of these modern lubricants fail rapidly, as depicted in Figure 4.
Condition Monitoring Strategies
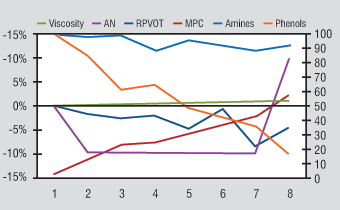
 Oil analysis has been the primary tool to detect incipient lubricant failure for the last half-century. The first step in determining an appropriate test slate for turbine oil is understanding its mode of failure. The authors were part of a research project that concluded in 2005, during which five turbine oils were circulated in immersion heated baths at 120 degrees Celsius for eight weeks. A wide range of analytical tests were performed in order to better understand which specific testing methodologies would provide the highest value for detecting early signs of turbine oil degradation and the associated by-products which negatively impact lubrication systems. Figures 5 and 6 represent a summary of results averaged from all five samples over the eight-week test. The traditional testing methodologies for monitoring the oxidative health of used turbine oils are viscosity, acid number and RPVOT. It is clear from this research that these tests do little to reveal early turbine oil degradation and nothing to identify the fluid's deposit tendencies. Here are a few of the more significant discoveries:
- The first physical sign of fluid degradation from this experiment was the creation of marginally soluble degradation products, which are known to produce varnish. These are commonly referred to as soft contaminants. Their concentrations were measured directly and trended using the membrane patch colorimetry (MPC) methodology. System varnish remains a high-profile and growing problem in today's lubricating, hydraulic and insulating systems.
- The first chemical sign of fluid degradation was observed by trending the depletion of the two primary antioxidants aromatic amine and hindered phenols. Voltammetry is typically the technique of choice for measuring antioxidants.
- There are direct correlations between the depletion of specific antioxidants and the formation of soft contaminants.
What about RPVOT?
The RPVOT test became an ASTM standard in the mid-1960s and has enjoyed several decades of high-profile use in helping end-users determine the remaining useful life of turbine oils. There has been a rising concern within the oil analysis industry, however, about using RPVOT on modern lubricant formulations that utilize complex antioxidant systems. The precision of the test in practice varies considerably compared to the precision statement in the ASTM standard. ASTM D2272 calls for a repeatability of 12 percent and a reproducibility of 22 percent for oils with values less than 1,000 minutes. Practically speaking, the repeatability and reproducibility of the test is generally accepted to be somewhere between 30 and 50 percent. A recently conducted mini-robin at an international standards institute reported 39 percent reproducibility. The recognized poor repeatability and reproducibility of the RPVOT test has made it much more difficult for data analysts to interpret.
| Test | Start of Test Value | End of Test Value | Comments |
|---|---|---|---|
| Viscosity (cSt @40 C) ASTM D-445 M |
31.7 | 32.1 | Insignificant; within test reproducibility |
| Acid number (mg KOH/g) ASTM D-664M |
0.10 | 0.11 | Insignificant; within test reproducibility |
| RPVOT (minutes) ASTM D-2272 | 945 | 900 | Insignificant; within test reproducibility |
| Membrane patch colorimetry (?E) ASTM WK-13070 |
2 | 57 | Significant; indicates high varnish potential |
| Ruler- Amines (% of new) ASTM D-6971 | 100% | 91% | Significant; close relationship to RPVOT values |
| Ruler - Phenols (% of new) ASTM D-6971 | 100% | 17% | Significant; MPC increases as phenols deplete |
