The Varnish Issue: and Successful Monitoring Acceptable Strategies
There are several obstacles to being able to successfully measure the levels of the resinous oxidation by-product commonly called varnish in today's gas and steam turbine or rust and oxidation (R&O) inhibited lubricating oils. The fi rst obstacle, a fully approved ASTM standardized test procedure, is still mired down in the political processes of an all-volunteer organization. However, a draft form* of the method is in active use by the testing industry and turbine users at the time of this writing. The second and possibly more significant obstacle is how to determine what is an acceptable level of this measurement of varnish that can provide trouble-free operation. Conversely, what is an unacceptable level that would warrant taking measures to prevent and remove varnish from the lubrication systems? Finally, the third obstacle to successful monitoring and establishing proper alarm levels is a constantly changing matrix of oil types and equipment types.
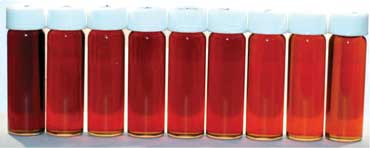 This article will first discuss the methods of varnish measurement and its correlation to other more well-established tests. Secondly, we will present ways to develop a reasonable system of predicting if the measurements are a serious indication of an impending problem and a way to measure the effectiveness of any anti-varnish measures.
Definitions
The discussion of the varnish issue in today's gas and steam turbine oils cannot be conducted without first talking about some problems with definitions of terms and language issues. The "varnish" we are talking about is NOT a stain-coating that is used on wooden products to impart a rustic brown-color; rather it is a resinous oxidation by-product with several root causes, which will be discussed later. The differences in the Oxford English language and American English language usages have given us a term of "resin" in Oxford and "varnish" in the American version, both referring to the same oxidation by-product. We will continue in the American vernacular in this article. Finally, we will try to resolve the difference between resin/varnish and sludge. ASTM lends a slight helping hand here by having a few references to a definition of "sludge" as being "varnish" that is associated with a water molecule.
Varnish is a sub-micron-sized soft contaminant that is polar in nature. It is thought to be somewhere around 0.01 microns in size, and this extremely small size has led to a whole new area of research called "sub-micron particle counting". Soft means it is not a liquid, nor is it a solid, and this makes physical trapping of varnish by mechanical means difficult. However, since it is polar in nature, and it can accept a positive or negative electrical charge, we can use this polarity to try and capture it.
Root Causes
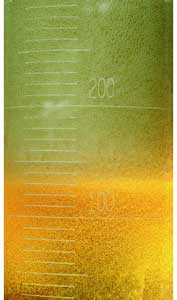 The majority of root causes for varnish formation in R&O oils are listed below in their order of occurrence, as seen in the Southeast Asia region:
- Foaming/air entrainment and bubble implosion
- Electrostatic spark discharges
- Additive depletion / additive incompatibilities
Adiabatic decompression is the technical term for the bubble implosion that takes place when oil bubbles in the lubricant do not completely rise back to the lubricant surface upon return to the lubrication reservoir. These suspended bubbles get sent back into active lubrication duty before they have had time to rise and disperse at the surface. They become highly compressed in between gear and bearing surfaces. Sometimes this is also referred to as micro-dieseling. In an effort to help explain the dieseling term, try to think of the main difference between a spark-ignition engine (gasoline/benzene engine) versus a compression-ignition engine (diesel engine). One uses a spark plug, and the other uses a high pressure/temperature rise as the source of ignition. Adiabatic decompression results in a high heat source of ignition that causes the air/hydrocarbon vapor of the bubble to combust (during implosion) and deposits an oxidation by-product, otherwise known as varnish.
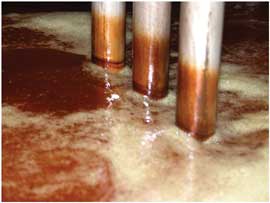 Electrostatic energy is generated by pushing oil through the pore of a mechanical filter. When we push too much oil through too small of a pore space, we generate too much static charge to be dissipated by normal means. This static charge will find a point of least resistance for discharge. This point is usually inside of a mechanical filter housing or at the tip of the lubricant return pipe to the reservoir. The sparking creates an oxidation by-product that is also known as varnish.
 Additive depletion can be a source of varnish in instances such as a phenyl-alpha-naphthylamine (PANA) type of anti-oxidant additive. This synergistic anti-oxidant additive type is good at rejuvenating itself when it depletes, but it does so by creating a soft and polar by-product. This by-product has also been lumped into the large category called varnish and is easy to identify since its solubility is very sensitive to temperature. It will cause an oil to appear hazy at ambient temperatures and clear at higher operating temperatures. Additive incompatibilities can be major or minor but will always be present even when mixing brands or types of oils and within the same API base-stock category.
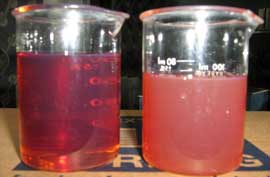
It is clear that there are at least three (and possibly more) very different root causes as the mechanisms involved in the varnish issue.
Standardized Testing
Varnish detection has been elusive in the past, not only due to a lack of standardized testing, but also due to a lack of understanding of what would be the best type of testing for the presence of this contaminant. It was common to see "free oil analysis reports" from oil companies that showed RPVOT, TAN and viscosity, all in their normal respective ranges, and thus no reason could be given for the varnish-related problems. Sasaki and others proved the existence of the varnish contaminant, and many parties around the world undertook the search for a test method.
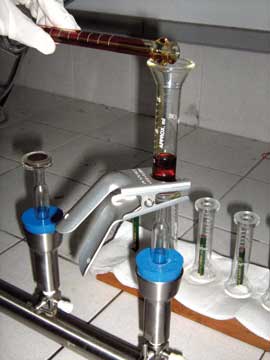 The ASTM answer was Work Instruction 13070. It was formed to create a standardized test, which was titled Membrane Patch Colorimetric Method. This has been dubbed by many as the MPC test. While it is still not in its final form, the draft version is in practice by many labs around the world. It is a less than perfect test, but it is better than nothing.
MPC patch testing involves diluting the sample of oil with a strong solvent and vacuum filtering the mixture through a fine-pore ultra-white colored membrane. This is not the best way to treat a fragile gel component like varnish that you are trying to quantify. The color of the residue that is left on the white membrane is measured by an international color scale known as the CIE L*a*b* color scale. (This is the same color scale used as the basis for photo software such as Adobe Photoshop). The delta CIE L*a*b* value between pure white and the residue color is given as the test result. The basic problems with the MPC test method are: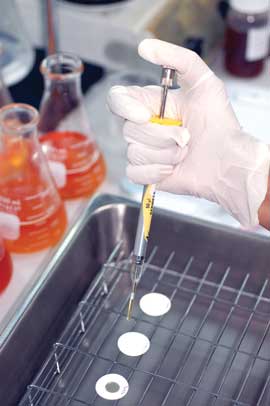
- Controlling the temperature of the oil/ solvent during preparation and filtration
- The lack of a standard test temperature for MPC
- Much of the data (dark oil color) is thrown away during filtration, which does not maximize the data density
- There is no differentiation between soluble and insoluble.
By measuring the weight of the patch residue in some repeatability testing, you can develop an idea of just how poor the repeatability of the MPC method is.
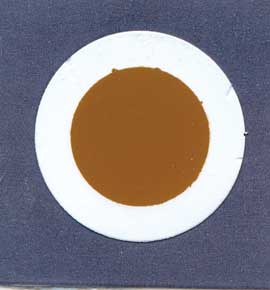 The MPC patch is a measurement of the varnish that is insoluble in the solvent, and thus it can be called an insoluble measurement only. An insoluble contaminant must have been a soluble contaminant at some point in time. The authors have devised an improved version of the MPC patch, which, when used in conjunction with the standard MPC patch, can help resolve some of the problems of the MPC patch but can also address the issues of how to properly establish what are acceptable and unacceptable levels of varnish, both soluble and insoluble.
We have already discussed that there are three very different root causes of an oxidation by-product, yet MPC is trying to measure these different contaminants by one single test method (a specific color range measurement). You must ask whether this is really a wise approach. Typical examples of MPC patches from the three types of varnish are given below. It is quite apparent that they have quite a variety of colors and intensities.
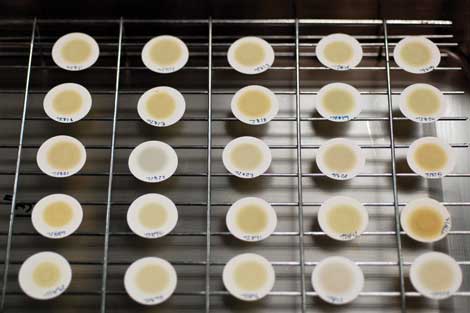 An improved type of MPC (iMPC) was developed based on many of the fundamentals of MPC (same color scale and same membrane). The iMPC uses the capillary pressure of the membrane and the straight oil, no dilution with solvent. The pure oil sample is adsorbed by the membrane and allowed to dry into a stain, not a residue. The color of the stain is measured and calculated the same way as the MPC patch residue. The delta CIE L*a*b* value between pure white and the residue color is given, and this way, there is no color data thrown down the drain during the vacuum filtration. The iMPC patch is a measurement of the total varnish that is present in the oil, the soluble varnish and the insoluble.
 Typical examples of iMPC patches (after drying) are given in the photos (on page 13). It is quite apparent that they are more consistent with each other. Thus, it is probable that iMPC is less sensitive to the root cause and mechanism of the varnish.
However, this is not to say that iMPC alone should be used for an evaluation. Rather, the simplest and best way to establish if an oil is functioning normally, or to establish if the oil is depositing (plating out) insoluble varnish onto the systems' metallic surfaces is to compare the ratio of the iMPC to the MPC. Since the iMPC value represents the total varnish (soluble and insoluble), it should always be numerically higher than the MPC value. The best situation is an approximate 3:1 or 2:1 ratio (iMPC to MPC). As the values become closer to 1:1, the higher the chance of varnish deposits in the system. An inverse value of a higher MPC to iMPC is a clear signal that significant varnish deposits exist inside a lubrication system.
An alternative to charting two different values is made easier by adding the iMPC and the MPC values and dividing by 2 for an average value. This practice is useful for trending and monitoring systems that are employing a varnish-removal filtration system.

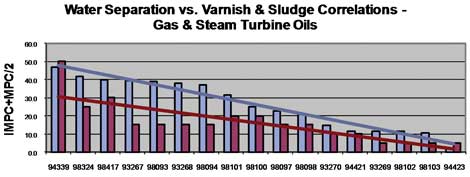
Correlation with other ASTM tests is also a desirable activity. It has been found that the following tests correlate well with the iMPC and MPC ratio procedure. The tests are given in the order of simplicity, cost of analysis and significance.
- Water separation characteristics (ASTM D1401)
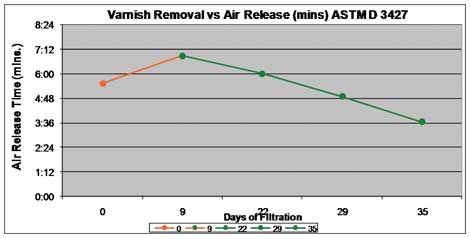
- Air release properties (ASTM D3427)
- Foaming tendency and stability (ASTM D892)
A Constantly Changing Matrix
The third obstacle to successfully monitor varnish and establish significant alarm levels is the constantly changing combination of equipment types and oil types (matrix). The various types of equipment that are using R&O oils are always being tweaked by their design engineers for what are perceived improvements, such as smaller lubricant reservoirs, combining lubricant functions and increasing machine output, but these changes also place higher stresses on the lubricant.
At the same time as this equipment design tweaking is taking place, the lubricants are also undergoing changes. However, unlike the equipment changes, which are very open and well documented in public, the lubricant tweaking goes by relatively unnoticed. Lubricants are tweaked and commonly sold under the same trade name, even though they may have had radical changes made to their formulation, such as changes in either the base-stock or the additive type. This is called reformulation in the lubricant business. This reformulation is sometimes due to refinery upgrading, which makes legacy base-stocks unavailable, or there may be a newly discovered undesirable characteristic of an additive that leads to its replacement. In either case, it is quite common for an oil to be known as "Brand ABC," even if it has really become "Brand DEF" and is still sold under the ABC trade name.
Reformulation is fine if equipment designs are stagnant, but in a constantly changing world of equipment designs, reformulation can sometimes lead to undesirable consequences, one of these being the varnish issue. Over the past 10 to 15 years, industrial lubricants with the same trade names have silently become composed of Group II and Group III base-stocks. It is no secret that Group II and III are better suited to the automotive lubricant market. However, Group I base-stocks are more soluble of varnish contaminants, and this makes better them industrial lubricants for many applications, but industrial lube sales volumes pale in comparison to automotive lube sales.

The quiet disappearance of Group Is started to have a pronounced negative effect called "varnish buildup". The Group category reformulations, coupled with the expanded use of PANA-type additives, led to a world-wide panic. It was not known for sure whether the single root problem was due to the changes in additives, base-stocks or equipment designs? In reality, it was probably due to a combination of all of the factors below:
- Design changes with smaller reservoirs and air entrainment issues
- Design changes of higher pump and flow pressures
- Design changes of higher efficiency filter pore sizes
- Reformulations of higher purity base-stocks
- Reformulations of additive types
- Reformulations of outsourced lubricant blending
More importantly, at the time as all of these factors were taking place, corporations around the world, both the OEMs and the oil companies, were talking to each other less and less via the avenues of all volunteer organizations like ASTM. This was largely due to economic cutbacks in all organization participation worldwide. It is now being realized that ASTM also works as a communication forum, not only as a standards organization, and this function cannot be overrated.
Varnish-Removal Systems
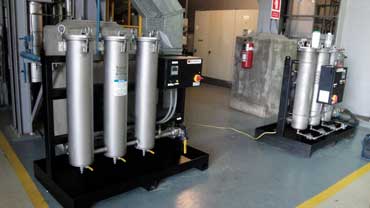
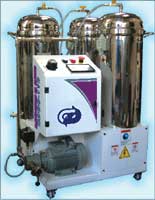
The last 10 years has seen a wide variety of varnish-removal systems being introduced to the market. Most have been aimed at removal (reactive), and some have also been oriented toward varnish prevention (proactive). The various system categories are listed here, in alphabetical order:
Agglomeration Electric-charge Filters
- The relative advantages of the agglomeration-type filters are:
- Effective with sub-micron particles, soluble and insoluble varnish
- High flow rates for large reservoirs
- Not affected by water content nor high oil temperature
- Use conventional filters of almost any type, the proprietary electrical charge component is fixed, and not changed (low operating costs)
- Best used as a preventive measure (prophylaxis)
Depth-media Filters
- The relative advantages of the depth-media filters are:
- The quick removal of larger more insoluble varnish like PANA
- Relative low upfront cost and low maintenance
- Not usually affected by water content
- Best used as a removal tool (for insoluble)
Precipitation Electric-charge Filters
- The relative advantages of the precipitation-type filters are:
- Relative low up-front costs Well suited for smaller reservoirs
- Effective with sub-micron particles, soluble and insoluble varnish
- Best used as a removal tool (for insoluble)
What the authors would like to see are various combinations of these technologies. In particular, the use of an agglomeration-type of charging system with a depth-media filter to collect the agglomerated varnish, instead of conventional fi ltration, would be preferred. An ideal system would maybe consist of all three technologies, an agglomerator, a precipitator and a depth media filter for collection.
Current Status of "The Varnish Issue"
Several factors are in place today that may be making a moot point of the varnish issue and at the same time bringing back to light some of the older, more traditional fundamentals of maintenance. Some of the factors that are making a moot point of the varnish issue are:
- PANA-types anti-oxidant additives are being phased out
- Varnish solubility additives are being introduced to the market that work in conjunction with electric-charge technology
- Group I base-stocks are being sought after as "boutique oil blends"
- OEMs and lubricant companies are participating more in all-volunteer organizations like ASTM
- Sub-micron particle counting is being researched and developed and will probably lead to better ways of monitoring soft contaminant issues.
A more significant answer to the varnish issue may be the ASTM Work Instruction 17912 for sub-micron particles less than 4 microns in size. This may be a more credible approach to the measurement issue, since it is not measuring a specifi c color range, but rather a specific size range, and will probably not discriminate what it is detecting by the root cause of the contaminant (color). While the Work Instruction 17912 is still very new and still in the infant stages, many hope it will overcome the problems inherent in the MPC patch.
All of the attention paid to the varnish issue has brought back into the forefront that prevention is much less costly than the cure (it is easier to keep things clean from the beginning than to clean them up after they are dirty). Most conservative research estimates will place the relative cost savings at about 80 to 90 percent. In other words, it only costs about 10 to 20 percent to implement a contaminant prevention program than it costs to remove the contaminants after they are in the system.
Recommended Best Practices for the Varnish Issue
- Don't purchase oil based on price-based specifications. Ask the OEMs and outside third-party consultants for guidelines and get general industry opinions. Remember that an approved vendor list does not say which oil on the list is the best performer and which oil on the list is the worst performer.
- Pay attention to keeping the oil clean from the very moment of commissioning in the case of new units and keep it clean from the very moment of replenishing oil on existing units. The worst assumption that you can make is that "the oil does not need to be kept clean now because it is new oil." Remember, it is 80 to 90 percent lower in cost to keep new oil clean than to purify it later after it is already contaminated.
- Have your machines oil analyzed to determine if there is an existing varnish problem or the potential for a problem is present. Apply the appropriate type of varnish-removal system according to your equipment type, oil type and reservoir size.
- Continuously monitor your oil with a third-party oil analysis service. Do not depend upon "free oil analysis" from an OEM or an oil supplier. Would you go to your local bartender for alcoholic-rehabilitation services?
*Varnish Test was officially adopted on Dec.5, 2012, a day after this paper was presented.
By Andy Sitton and Thanant Siristhchote, Focuslan Ltd., Bangkok, Thailand
Joining my sister at the emergency room for an issue with her son was an enlightening moment. The ER doctor walked in, reviewed some historical records on my nephew and began asking questions. As any mother would do, my sister gave the doctor a wealth of information, both relevant and not so relevant, to the current situation. It was the doctor's job to filter the information and determine what was truly important and helpful. He kept pressing for more information and grilling my sister for clarification on even the smallest comment, which to her may have seemed inconsequential, but to him was significant.
I couldn't help but realize that this scenario is repeated quite often in our world of oil analysis, with a few changes in characters. In oil analysis, the patient is a machine. More specifically, it is a component of something larger. The end user has the vested interest in the health of the component, and the person evaluating the oil sample data is the doctor.
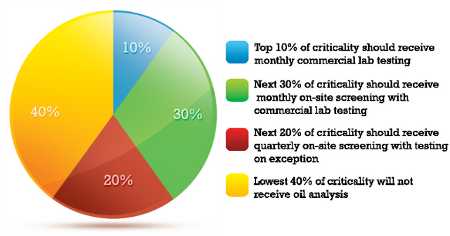
Example of an Oil Analysis Program Strategy
A survey of 3,000 rotating assets showed that there were 1,500 oil-filled components (including pumps, gearboxes, hydraulic and lube oil reservoirs). In theory, there could be 1,500 oil samples collected at some interval. Studies showed that this was not financially feasible, and therefore the following criticality-based strategy was implemented.
In the case of evaluating oil sample data, it is important to realize that few problems can be resolved based on a single data set or a single test. Like the doctor in the ER, an oil analyst needs to have some historical data on the component being checked. This means the analyst must know the right questions to ask and have the ability to hear what is being said, not just listening to the words. One of the first questions to ask when reviewing oil analysis data is, "What is the objective of the plant for this specific component?" It is fully possible and often quite warranted to have a different oil analysis strategy for different components assigned to the oil analysis program. The appropriate oil analysis strategy should be assigned based on component criticality. During the development of component criticality, a whole new set of issues arises, including:
- Health, safety and environmental effects if failure occurs
- Production loss impact due to failure
- Potential costs of repair due to failure
- Historical mean time between failures (MTBF)
- Effectiveness of early warning systems
Understanding component criticality is absolutely vital in establishing an appropriate oil analysis strategy. I was recently in a mill where components were added to the oil analysis program on an ad-hoc basis. In short, if a component failed, it was then added to oil analysis. At another mill, the maintenance manager wanted all oil-filled components to go through oil analysis. Obviously, neither of these strategies will end with the desired result, which should be early identification of potential failure using a proven method to cost effectively monitor equipment condition.
Test Slate and Test Interval
The next question to be asked should be, "Is the current test slate and test interval capable of supplying the information we need to meet the plant objectives for this component?"
When developing an oil analysis strategy, we must consider two primary components: test slate and test interval. Both of these components may change depending on the strategy taken.
Some of the best oil analysis programs utilize a hybrid approach of on-site and off-site testing. In future columns, we will explore how to develop oil analysis strategies and form a cost benefits analysis for both approaches.
In summary, there is no blanket strategy for oil analysis. The goal is to exercise a method by which a well-developed oil analysis program can be implemented and maintained. In doing so, the right questions need to be asked with relevant information being supplied to the analyst of the data, whether that analyst is on-site or remote. Once this takes place, we can ensure the program will be in a better position to achieve the desired results at an affordable cost.
By the way, my nephew ended up doing well after his ER visit. If we get it right, our machines can survive simply through the routine visits.
