Anatomy of an Oil Analysis Report
This is the fifth part of a series of “anatomy” lessons within Machinery Lubrication. In this issue, a specific device or object will not be dissected but rather the content provided in a typical oil analysis report, including how to interpret the data and other findings. These interpretations may decide either the cost or avoidance of machine failure and downtime.
Interpreting an oil analysis report can be overwhelming to the untrained eye. Oil analysis isn’t cheap, and neither is the equipment on which it reveals information. Every year, industrial plants pay millions of dollars for commercial laboratories to perform analysis on used and new oil samples. Unfortunately, a majority of the plant personnel who receive these lab reports do not understand the basics of how to interpret them.
What to Look for When Reviewing an Oil Analysis Report
-
Read and check the data on the oil type and machine type for accuracy.
-
Verify that reference data is shown for new oil conditions and that trend data is at an understood frequency (preferably consistent).
-
Check the measured viscosity.
-
Verify elemental wear data and compare to reference and trended data. Use a wear debris atlas to match elements to their possible source.
-
Check the elemental additive data and compare to reference and trended data. Use a wear debris atlas to match elements to their possible source.
-
Verify elemental contamination data along with particle counts and compare with reference and trended data. Use a wear debris atlas to match elements to their possible source.
-
Check moisture/water levels and compare to reference and trended data.
-
Verify the acid number and base number and compare to reference and trended data.
-
Check other analyzed data such as FTIR oxidation levels, flash point, demulsibility, analytical ferrography, etc.
-
Compare any groups of data that are trending toward unacceptable levels and make justifications based on these trends.
-
Compare written results and recommendations with known information on the oil and machine, such as recent changes in environmental or operational conditions or recent oil changes/filtration.
-
Review alarm limits and make adjustments based on the new information.
Typically, an oil analysis report comes with a written summary section that attempts to put the results and recommendations in layman’s terms. However, since the laboratory has never seen the machine or know its full history, these recommended actions are mostly generic and not precisely tailored to your individual circumstances. Therefore, it is the responsibility of the plant personnel who receive the lab report to take the proper action based on all known facts about the machine, the environment and recent lubrication tasks performed.
Why Perform Oil Analysis
An obvious reason to perform oil analysis is to understand the condition of the oil, but it is also intended to help bring to light the condition of the machine from which the oil sample was taken. There are three main categories of oil analysis: fluid properties, contamination and wear debris.
Fluid Properties
This type of oil analysis focuses on identifying the oil’s current physical and chemical state as well as on defining its remaining useful life (RUL). It is designed to answer questions such as:
- Does the sample match the specified oil identification?
- Is it the correct oil to use?
- Are the right additives active?
- Have additives been depleted?
- Has the viscosity shifted from the expected viscosity? If so, why?
- What is the oil’s RUL?
Contamination
By detecting the presence of destructive contaminants and narrowing down their probable sources (internal or external), oil analysis can help answer questions such as:
- Is the oil clean?
- What types of contaminants are in the oil?
- Where are contaminants originating?
- Are there signs of other types of lubricants?
- Is there any indication of internal leakage?
Wear Debris
This form of oil analysis is about determining the presence and identification of particles produced as a result of mechanical wear, corrosion or other machine surface degradation. It answers a number of questions relating to wear, including:
- Is the machine degrading abnormally?
- Is wear debris produced?
- From which internal component is the wear likely originating?
- What is the wear mode and cause?
- How severe is the wear condition?
Ultimately, you need to know if any actions should be taken to keep the machine healthy and to extend the life of the oil. Oil analysis for machines can be compared to blood analysis for the human body. When a doctor pulls a blood sample, he puts it through a lineup of analysis machines, carefully studies the results and reports his conclusions based on his education, research and detailed questions asked to the patient. Likewise, with oil analysis, careful oil samples are taken, and elaborate machines yield the test results. Laboratory personnel interpret the data to the best of their ability, but without crucial details about the machine, a diagnosis or prognosis can potentially be inaccurate. Some of these important details include:
- The machine’s environmental conditions (extreme temperatures, high humidity, high vibration, etc.)
- The originating component (steam turbine, pump, etc.), make, model and oil type currently in use
- The permanent component ID and exact sample port location
- Proper sampling procedures to confirm a consistently representative sample
- Occurrences of oil changes or makeup oil added, as well as the quantity of makeup oil since the last oil change
- Whether filter carts have been in use between oil samples
- Total operating time on the sampled component since it was purchased or overhauled
- Total runtime on the oil since the last change
- Any other unusual or noteworthy activity involving the machine that could influence changes to the lubricant
| Oil Analysis Category | Tests |
|---|---|
| Fluid Properties | Viscosity, Acid/Base Number, FTIR, Elemental Analysis |
| Contamination | Particle Counting, Moisture Analysis, Elemental Analysis |
| Wear Debris | Ferrous Density, FTIR, Elemental Analysis |
Oil Analysis Tests
For a standard piece of equipment undergoing the normal recommended oil analysis, the test slate would consist of “routine” tests. Alternatively, if additional testing is needed to answer advanced questions, these would be considered “exception” tests. Routine tests vary based on the originating component and environmental conditions but should almost always include tests for viscosity, elemental (spectrometric) analysis, moisture levels, particle counts, Fourier transform infrared (FTIR) spectroscopy and acid number. Other tests that are based on the originating equipment include analytical ferrography, ferrous density, demulsibility and base number testing.
The table on the left shows how tests are utilized in each of the three main oil analysis categories.
Viscosity
Several methods are used to measure viscosity, which is reported in terms of kinematic or absolute viscosity. While most industrial lubricants classify viscosity in terms of ISO standardized viscosity grades (ISO 3448), this does not imply that all lubricants with an ISO VG 320, for example, are exactly 320 centistokes (cSt). According to the ISO standard, each lubricant is considered to be a particular viscosity grade as long as it falls within 10 percent of the viscosity midpoint (typically that of the ISO VG number).
Viscosity is a lubricant’s most important characteristic. Monitoring the oil’s viscosity is critical because any changes can lead to a host of other problems, such as oxidation, glycol ingression or thermal stressors.
Too high or too low viscosity readings may be due to the presence of an incorrect lubricant, mechanical shearing of the oil and/or the viscosity index improver, oil oxidation, antifreeze contamination, or an influence from fuel, refrigerant or solvent contamination.
Limits for changes in the viscosity depend on the type of lubricant being analyzed but most often have a marginal limit of approximately 10 percent and a critical limit of approximately 20 percent higher or lower than the intended viscosity.
Acid Number/Base Number
| Wave Number | Oil Parameter |
|---|---|
| 1750 | Oxidation (for mineral oils) |
| 3540 | Oxidation (for organic ester) |
| 815 | Oxidation (for phosphate ester) |
| 1150 | Sulfation (possibly from high-sulfur fuel contamination) |
| 1630 | Nitration (typically with natural gas engines) |
| 3625 | Water ingression (for organic ester) |
| 3400 | Water ingression (for mineral oils) |
| 2000 | Soot (combustion chamber blow-by contamination) |
| 880, 3400, 1040, 1080 | Glycol ingression |
| 800 | Diesel fuel ingression |
| 750 | Gasoline fuel ingression |
| 795-815 | Jet fuel ingression |
| 3650 | Phenol inhibitors additive depletion |
| 980 | ZDDP anti-wear/antioxidant additive depletion |
Acid number and base number tests are similar but are used to interpret different lubricant and contaminant-related questions. In an oil analysis test, the acid number is the concentration of acid in the oil, while the base number is the reserve of alkalinity in the oil. Results are expressed in terms of the volume of potassium hydroxide in milligrams required to neutralize the acids in one gram of oil. Acid number testing is primarily performed on non-crankcase oils, while base number testing is mainly for over-based crankcase oils.
An acid number that is too high or too low may be the result of oil oxidation, the presence of an incorrect lubricant or additive depletion. A base number that is too low can indicate high engine blow-by conditions (fuel, soot, etc.), the presence of an incorrect lubricant, internal leakage contamination (glycol) or oil oxidation from extended oil drain intervals and/or extreme heat.
FTIR
FTIR is a quick and sophisticated method for determining several oil parameters including contamination from fuel, water, glycol and soot; oil degradation products like oxides, nitrates and sulfates; as well as the presence of additives such as zinc dialkyldithiophosphate (ZDDP) and phenols. The FTIR instrument recognizes each of these characteristics by monitoring the shift in infrared absorbance at specific or a range of wavenumbers. Many of the observed parameters may not be conclusive, so often these results are coupled with other tests and used more as supporting evidence. Parameters identified by shifts in specific wavenumbers are shown in the table below.
Elemental Analysis
Elemental analysis works on the principles of atomic emission spectroscopy (AES), which is sometimes called wear metal analysis. This technology is designed to detect the concentration of wear metals, contaminants or additive elements within the oil. The two most common types of atomic emission spectroscopy are rotating disc electrode (RDE) and inductively coupled plasma (ICP). Both of these methods have limitations in analyzing particle sizes, with RDE limited to particles less than 8 to 10 microns and ICP limited to particles less than 3 microns. Nevertheless, they are useful for providing trend data. Possible sources of many common elements are shown in the table below.
The best way to monitor this type of data is to first determine what is expected to be in the oil. An effective oil analysis report will provide reference data for the new oil so any amounts of additive elements can be easily distinguished from those of contaminants. Also, because many types of elements should be expected at some level (even contaminants in certain environments), it is better to analyze trends rather than focus on any specific measurement of elemental analysis data.
| Element | Possible Sources |
|---|---|
| Aluminum | Pistons, bearings, pumps, thrust washers |
| Antimony | Bearings, grease |
| Barium | Rust and oxidation inhibitor additives, grease |
| Boron | Anti-corrosion additives in coolant, dust, water |
| Calcium | Detergent/dispersant additives |
| Chromium | Piston rings in internal combustion engines |
| Copper | Bearings, brass/bronze alloys, bushings, thrust washers |
| Iron | Shafts, rolling-element bearings, cylinders, gears, piston rings |
| Lead | Bearings, fuel additives, anti-wear additives |
| Lithium | Grease, additives |
| Magnesium | Transmissions, detergent additives |
| Molybdenum | Piston rings, electric motors, extreme-pressure additives |
| Nickel | Bearings, valve train, turbine blades |
| Phosphorus | Anti-wear additives, extreme-pressure gear additives |
| Potassium | Coolant additives |
| Silver | Bearing cages (plating), gear teeth, shafts |
| Silicon | Dust/dirt, defoamant additives |
| Sodium | Detergent or coolant additives |
| Tin | Journal bearings, bearing cages, solder |
| Titanium | Bearing hub, compressor blades |
| Zinc | Neoprene seals, grease, anti-wear additives |
Particle Counting
Particle counting measures the size and quantity of particles in the oil. Many techniques can be used to assess this data, which is typically reported based on ISO 4406:99. This standard designates three numbers separated by a forward slash providing a range number that correlates to the particle counts of particles greater than 4, 6 and 14 microns. View an illustration of how different particle counts are assigned specific ISO codes.
Moisture Analysis
Moisture content within an oil sample is commonly measured with the Karl Fischer titration test. This test reports results in parts per million (ppm), although data is often shown in percentages. It can find water in all three forms: dissolved, emulsified and free. The crackle test and hot-plate test are non-instrument moisture tests for screening before the Karl Fischer method is used. Possible reasons for a moisture reading being too high or too low would include water ingression from open hatches or breathers, internal condensation during temperature swings or seal leaks.
Interpreting Oil Analysis Reports
The first thing to check on an oil analysis report is the information about the customer, originating piece of equipment and lubricant (see Section A of the sample report on page 49). Including these details is the customer’s responsibility. Without this information, the effectiveness of the report will be diminished. Knowing which piece of equipment the oil was sampled from affects the ability to identify potential sources of the measured parameters, especially wear particles. For example, the originating piece of equipment can help associate reported wear particles with certain internal components. The lubricant information can provide a baseline for several parameters, such as the expected viscosity grade, active additives and acid/base number levels. These details may seem straightforward but are often forgotten or illegible on the oil sample identification label or request form.
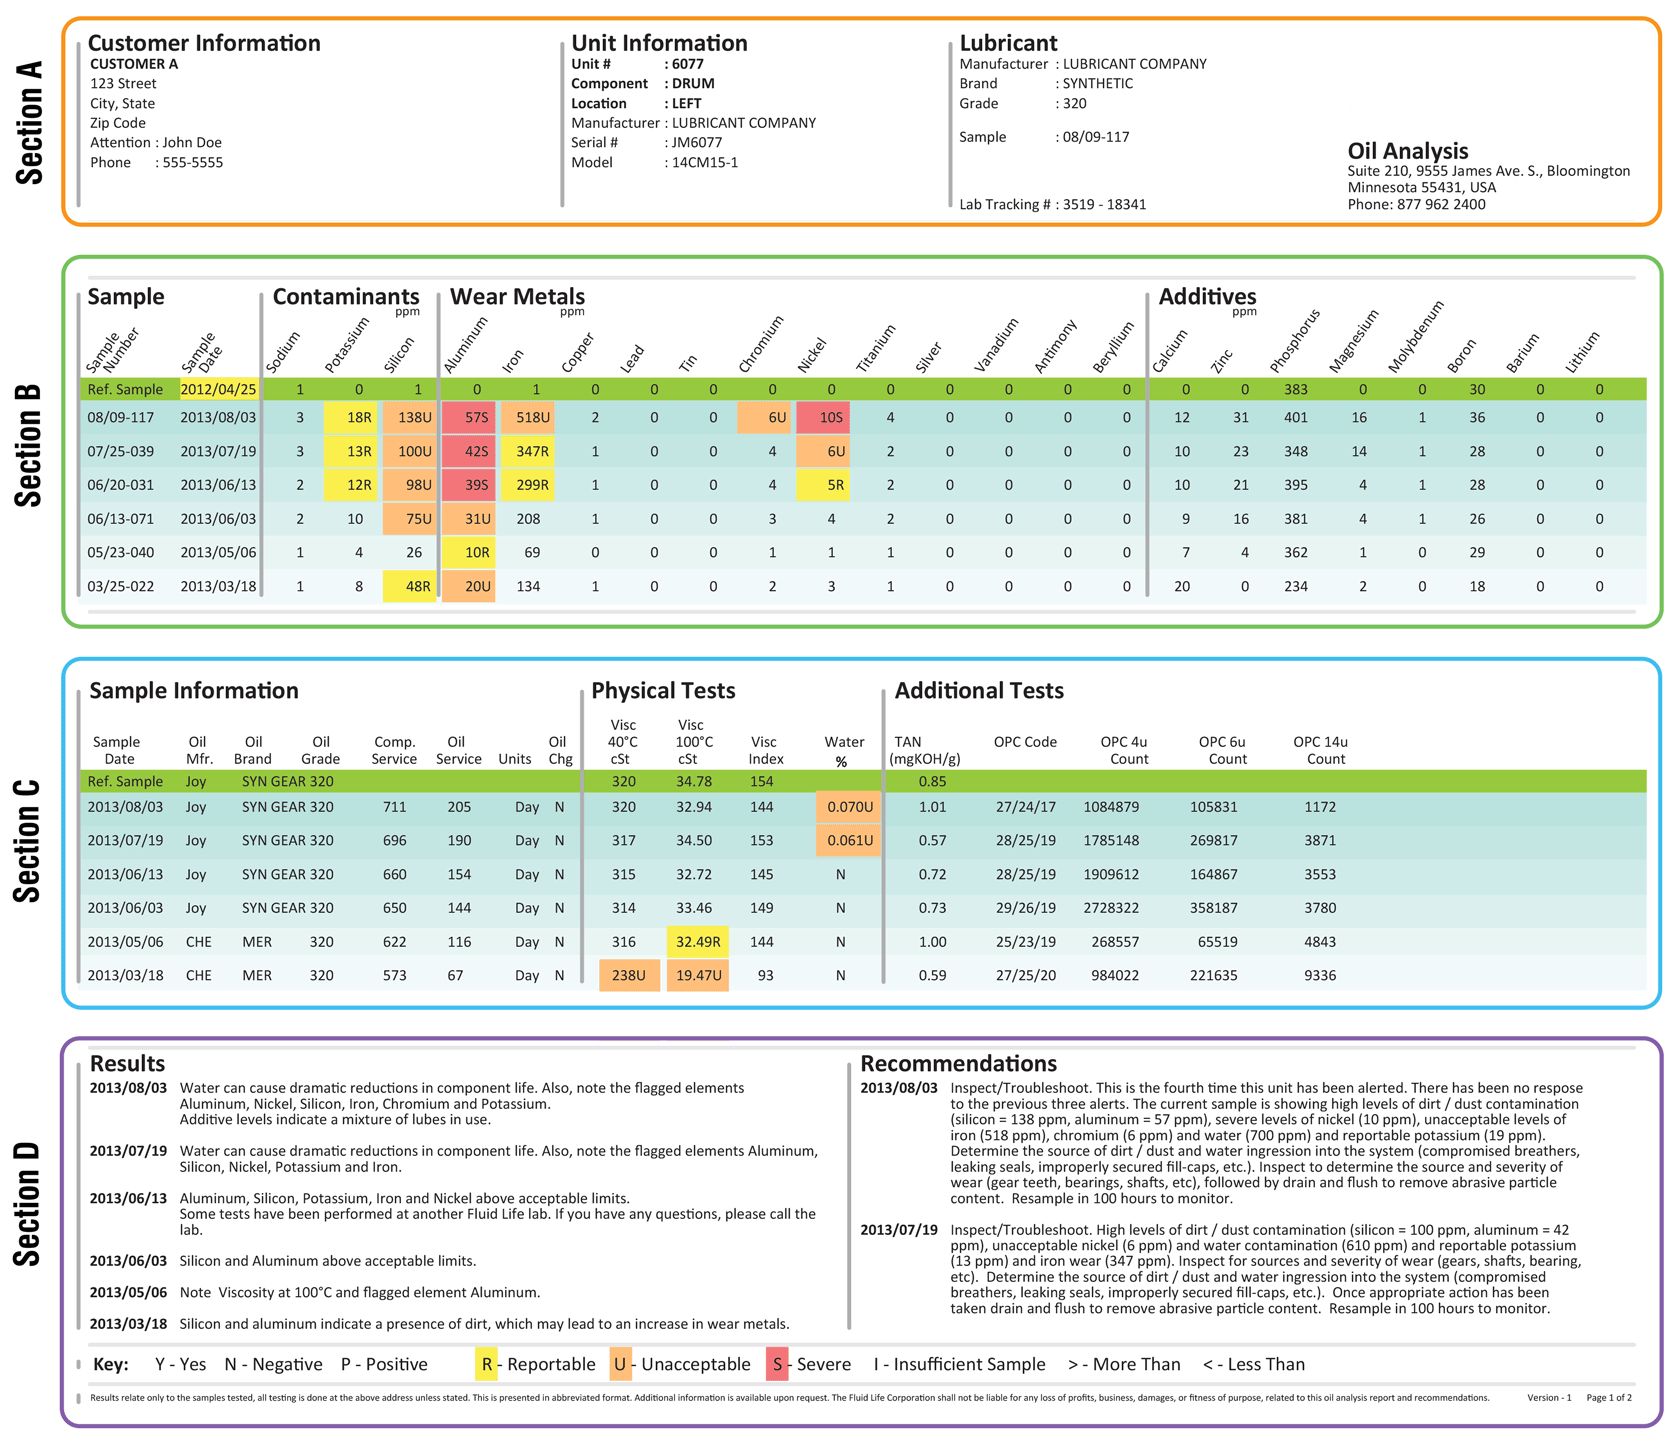
The next section (Section B) of the oil analysis report to examine is the elemental analysis or FTIR breakdown. This data can help identify contamination, wear metals and additives present within the oil. These parameters are reported in parts per million (ppm). Nevertheless, this does not mean a contamination particle, for example, can only be indicated by sodium, potassium or silicon spikes. In the example above, the rise in silicon and aluminum could potentially indicate dust/dirt contamination as the root cause. One likely explanation for these spikes is that as dirt (silicon) enters the oil from an external source, three-body abrasion occurs within the machine, causing wear debris including aluminum, iron and nickel to increase.
With a better understanding of the metallurgy within the system’s components, any spikes in wear metals can be better associated, allowing a proper conclusion as to which internal components are experiencing wear. Keep in mind that for trend analysis, it is important that samples are taken at an appropriate and uninterrupted frequency.
")
With elemental data related to contaminants and wear metals, alarms are set for upward trends in the data. For elemental data pertaining to additives, alarms are set for downward trends. Having a baseline of new lubricant reference data is critical in assessing which additives are expected and at what levels. These baselines are then established to help determine any significant reduction in specific additives.
Another section of the oil analysis report presents previously identified sample information from the customer such as oil manufacturer, brand, viscosity grade and in-service time, as well as if an oil change has been performed. This is important data that can provide an explanation for what could be false positives in alarming data changes.
The “physical tests” section of a report offers details on viscosity at both 40 degrees C and 100 degrees C, along with the viscosity index and percentage of water. For common industrial oils, the viscosity measurement at 40 degrees C is usually given, since this correlates to the oil’s ISO viscosity grade. If the viscosity index must also be calculated, such as for engine oil, then these additional viscosity measurements will be identified. The viscosity for engine crankcase oils is typically reported at 100 degrees C.
Water contamination, which commonly is measured by the Karl Fischer test, is presented in percentages or ppm. While some systems are expected to have high levels of water (more than 10,000 ppm or 10 percent), the typical alarm limits for most equipment are between 50 to 300 ppm.
The “additional tests” section shows two final tests: acid number (AN) and particle size distribution (aka, particle count). When analyzing the acid number, you should have both a reference value and the ability to trend from past analysis. The acid number often will jump considerably at some point. This may be your best indicator for when the oil is oxidizing rapidly and should be changed.
>*Gas compressors only ** Air compressors only ***For phosphate ester fluids, consult the fluid supplier and/or turbine manufacturer. R = Routine testing E = Exception test keyed to a positive result from the test in parentheses
The last section of the oil analysis report generally provides written results for each of the final few test samples along with recommendations for required actions. Typically, these recommendations are entered manually by laboratory personnel and based on information provided by the customer and the data collected in the lab. If there is an explanation for the data that stems from something not explicitly stated by the customer, the results must be reinterpreted by those familiar with the machine’s history of environmental and operating conditions. Understanding the information given here is critical. Remember, there is always an explanation for each exceeded limit, and the root cause should be investigated.
| Test or Procedure | Paper Machine Oils | Motor and Pump Bearings | Diesel and Gas Engines | Hydraulics | Air and Gas Compressors | Chillers and Refrigeration | Transmissions, Final Drives, Differentials | Industrial Gear Oils | Steam Turbine Oils | Gas Turbine Oils | EHC Fluids*** |
|---|---|---|---|---|---|---|---|---|---|---|---|
| 1. Particle Count | R | R | R | R | R | R | R | R | R | R | R |
| 2. Viscosity | |||||||||||
|
R | R | – | R | R | R | R | R | R | R | R |
|
– | – | R | – | – | – | – | – | – | – | – |
| 3. AN | R | E(5a) | – | R | R | R | R | R | R | R | R |
| 4. BN | – | – | R | – | – | – | – | – | – | – | – |
| 5. FTIR | |||||||||||
|
R | R | R | R | R | R | R | R | R | R | – |
|
– | R | – | R | R | – | – | R | R | – | – |
|
– | R | – | R | R | – | R | R | – | – | – |
|
– | – | R | – | – | – | – | – | – | – | – |
| 6. Flash Point | – | – | R | – | R* | – | – | – | – | E(2b,5d) | – |
| 7. Glycol-ASTM Test | – | – | E(8,14 b) | – | – | – | – | – | – | – | – |
| 8. Ferrous Density | E(1) | E(1) | R | R | R | R | R | R | E(1) | E(1) | R |
| 9. Analytical Ferrography | E(8,14a) | E(8,14a) | E(8,14a) | E(8,14a) | E(8,14a) | E(8,14a) | E(8,14a) | E(8,14a) | E(8,14a) | E(8,14a) | E(8,14a) |
| 10. RPVOT | – | – | – | – | R | – | – | – | R | R | – |
| 11. Crackle | R | R | R | R | R** | R | R | R | R | – | R |
| 12. Water by KF | E(11) | E(11) | E(11) | E(11) | E(11)** | E(11) | E(11) | E(11) | E(11) | – | E(11) |
| 13. Water Separability | R | – | – | – | R** | – | – | – | R | – | – |
| 14. Elemental Analysis | |||||||||||
|
R, E(1) | R, E(1) | R | R, E(1) | R, E(1) | R, E(1) | R | R, E(1) | R, E(1) | R | R, E(1) |
|
R | R | R | R | R | R | R | R | R | R | R |
|
R | R | R | R | R | R | R | R | R | R | R |
In addition to the raw data shown throughout the oil analysis report, graphs can help illustrate notable trends in the data. Below is an example of trended data points from analyzed data, with the water test having the most notable unfavorable spike. Along with the trend data, graphs should show typical averages, warning (marginal) limits and alarm (critical) limits. These limits should be modified depending on the type of data collected, the type of lubricant and the machine’s known operating conditions.
Standard alarm limits will be set by the oil analysis laboratory. However, if there is any reason to adjust these limits higher or lower, they should be identified properly. Examples of limits that should be lowered would be those for highly critical assets or assets that are consistently healthy. A small spike in data would be cause to run an exception test or an immediate second sample for analysis. In such cases, a second sample would ensure the data received is representative of the oil conditions and not simply a human error in sampling or analysis. If exception tests are needed, the chart above shows which tests would be appropriate when a given routine test limit has been exceeded.