A Better Way to Test Grease Consistency
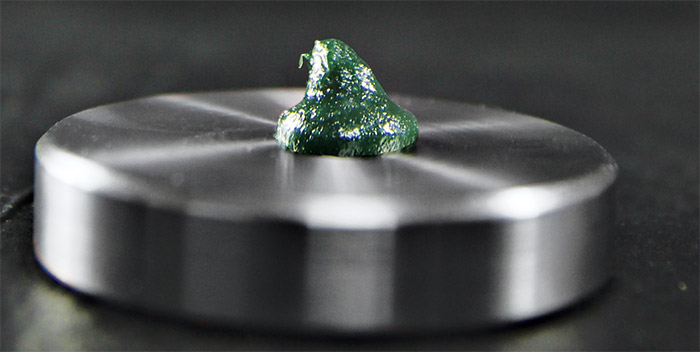
Grease is a complex material that can be manufactured using dramatically different base oil viscosities and thickener types. Variations in soap content and composition can be expected as grease batches are made. Grease testing is primarily performed to support quality assurance and marketing of new grease products. Cone penetration is considered the most important of the laboratory-performed tests. While this ASTM test method provides a measure of grease consistency or stiffness, it is not well-suited for used grease, as it requires a large sample, which precludes its use for in-service testing. Alternative tests to cone penetration have been developed in which touch is utilized to characterize grease stiffness, but these test methods typically are crude and do not lend themselves to accurate results or trend analysis. However, other options that involve the use of stress rheometers have proven to be not only acceptable but preferred for monitoring the consistency of new and in-service grease.
Problems with Cone Penetration
The cone penetration method employs a weighted cone that is dropped into a fixed-size volume of grease for a defined time period. The depth that the cone is able to penetrate the grease is used to rate the grease’s consistency with a scale developed by the National Lubricating Grease Institute (NLGI). This test utilizes three different cup and cone sizes. The cups vary from a large (full scale) size of about 290 milliliters (ml) to a small size of 3.8 ml (one-quarter scale). The cup size determines the amount of grease required to conduct a test. Test samples obtained from field sources are generally much smaller than would be required for a cone penetration test.
Many sumps in field-lubricated applications contain less total grease than the cup volume of 290 ml, which is the minimum quantity needed for the full-scale test. Even a volume of 3.8 ml (one-quarter scale) is still greater than the majority of samples obtained from the field. Since more grease is needed to conduct a penetration test than is generally available, this test methodology is clearly a poor choice for an in-service or condition monitoring test.
The cone penetration test can be performed in a worked or unworked condition. The intent is to test the grease samples with a similar level of pre-conditioning for a more consistent result. The common pre-conditioning of a worked cone penetration sample test is to be sheared for 60 strokes. However, this pre-conditioning practice is only intended for new greases. In-service grease receives no pre-conditioning prior to machine operation; the machine simply starts.
The reporting method used for the cone penetration test is also very crude, and the results can be misleading. The NLGI numbering system appears to be linear (0, 1, 2, 3, etc.), but the grease consistency changes are not linear. For example, it would be reasonable to assume that an NLGI 4 grease would be twice as stiff as an NLGI 2 and four times as stiff as an NLGI 1. However, this is not the case.
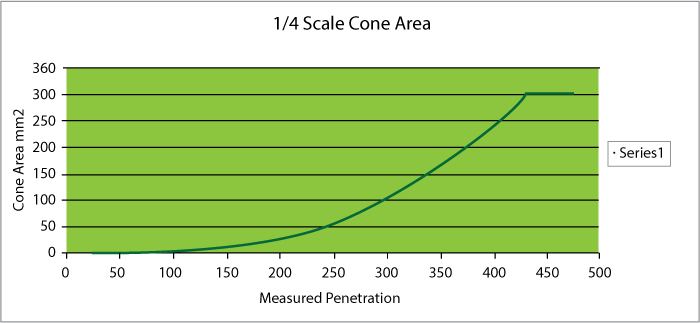
Figure 1 was developed by determining the surface area in contact with the grease for increasing depths of the cone. These depths were then compared and plotted. It is clear that the change in surface area in contact with the grease is non-linear.
Use of the NLGI scale permits tremendous product variation, which becomes more pronounced with stiffer greases. This allows the producer a huge manufacturing margin in the product’s rheological properties within a given NLGI grade.
The NLGI scale also provides gaps in the numbered measurements. These gaps are very large when considered in units of stress (pascals). For example, a grease defined as NLGI 2 can be manufactured at either end of the scale. The extremes, when compared in stress measurements, have differences in stiffness of 175 percent from the high to low end of the NLGI 2 grade. The range in pascals for the gap between the NLGI 3 and 4 greases is the same as the total range from the soft end of NLGI 00 through to the midpoint NLGI 2 (see Table 1). These gaps can be a bit of a minefield, and confusion is likely for those not familiar with the non-liner nature of the NLGI measuring system.
Using a Rheometer
A rheometer is an instrument capable of measuring the physical properties of a grease by varying or holding constant an applied load, a temperature and an oscillatory shear. It is successfully used in many industries with a broad variety of applications. A rheometer also requires minimal quantities of test material when compared to cone penetration, with typical grease test volumes of 0.4 to 0.25 ml.
Use of a rheometer to test grease samples is very limited within the grease industry. While a rheometer measurement is likely to be unfamiliar to many, it can be reported in accepted scientific units (pascals) and in a manner that does not include gaps.
Yield Stress Test
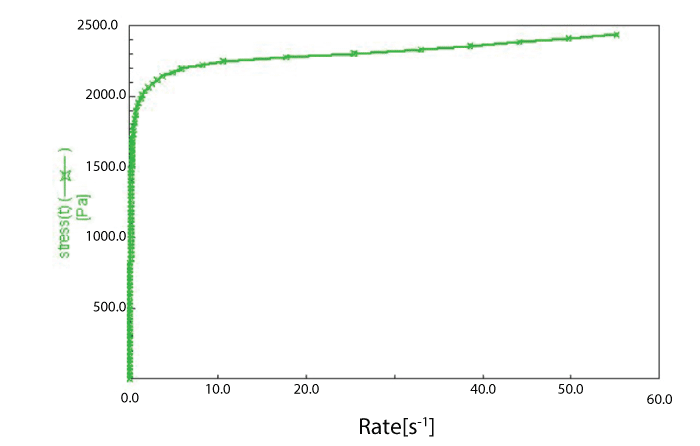 The yield stress test is useful when comparing rheometer-derived data to cone penetration. This test produces a stress that ramps up from very low to high at an increasing rate. It plots a data point at even time increments. As the test runs, each successive data point plots in a near vertical pattern as long as the material is primarily elastic and in a more horizontal orientation when it becomes fluid and flows. The intercept/line fit from the flatter sloped portion of the plot to the Y axis is used to determine the yield stress. This measurement represents the stress at which the grease shifts from being a more elastic material to more of a fluid under the prescribed test conditions (Figure 2).
Temperature can significantly influence the results of a yield stress test, which makes temperature control vital. This is accomplished with a heat sink at the instrument.
Some rheological tests are designed to take hours or days to complete. These lengthy tests can be expected to yield precise results but are not practical for most in-service grease samples within a production testing environment. The ideal production test would be one that provides a reasonably accurate test result and has a short test duration.
The yield stress test results shown in Figure 2 were obtained by performing a series of tests to include a stress and frequency sweep within a common test sequence, with the yield stress test performed last. The tests chosen prior to the yield stress test were useful in determining the grease’s characteristics. Some pre-conditioning of each grease sample resulted from the test sequence used.
The initial sample was placed on a 25-millimeter flat plate and lowered to a typical 1-millimeter gap distance. The grease was then trimmed to ensure an even edge with no undercutting of the sample. Upon completion of each test within the sequence, the head was automatically lowered by software within the instrument to ensure contact between the fixture and no undercutting of the sample. The sample edge was not trimmed between tests within the sequence. The settings for gap reduction used to lower the head were the same for each sample.
A short dwell or recovery time of less than a minute was allowed between each test within the sequence. Use of a multiple test sequence enabled each grease sample to be tested in a similar manner and with a similar level of pre-conditioning. The test that produced consistent pre-conditioning was a frequency sweep test, which was set to run for approximately seven minutes. The entire sample testing took only a few minutes longer. The yield stress rheometer test required less than a minute of the overall test time to complete.
Test Data
A population of 54 new or used field samples were tested using both the one-quarter-scale cone penetration method and the yield stress rheometer test. This population consisted of six different types of new greases including a polyurea, lithium complex, calcium complex, and clay and calcium sulfonate. In-service used grease samples included clay- and calcium-complex-thickened greases. Two of the samples tested were provided by NLGI to help determine cone penetration values from a group of collaborators. The material type of these samples was unknown.
All grease samples were treated as unworked, with the only pre-conditioning being the process of obtaining the test sample from the bulk grease and placing it into the cup. No efforts were made to determine the level of working that the used samples received while in the field. The cone was dropped into each sample three times, and the average measured test value was reported. The tests were conducted at a laboratory ambient temperature, which was typically at 22-24 degrees C.
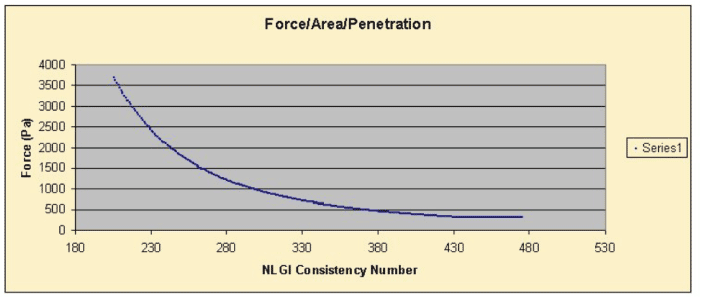
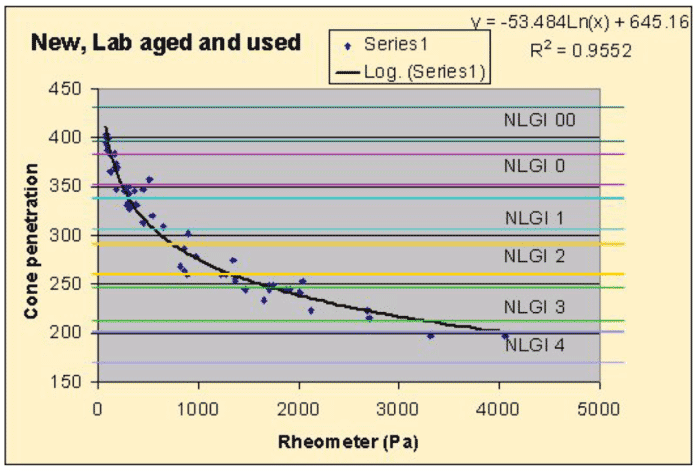
When compared to rheometer-generated data, the non-linear aspect of the NLGI scale is clearly seen in Figure 3. Figure 4 shows samples measured by both methods and how the points correlated. The rheometer measurements are compared to the NLGI scale in Table 1. Note that the gaps between the defined consistency ranges become progressively larger with the stiffer greases.
| NLGI Grade | Rheometer Low End (PA) | Rheometer High End (PA) | Rheometer Gap to Next Grade (PA) | % Delta from Previous Grade High to Next Low |
|---|---|---|---|---|
| 00 | 56 | 98 | 32 | 32.6% |
| 0 | 130 | 227 | 73 | 32.1% |
| 1 | 300 | 527 | 160 | 32.2% |
| 2 | 697 | 1,221 | 396 | 36.9% |
| 3 | 1,617 | 2,833 | 917 | 32.4% |
| 4 | 3,750 |
Repeatability
To determine instrument and test sequence repeatability, three grease types were used in the test sequence, with multiple runs performed on each grease. The source of the grease was a single container for each type. The grease types tested included lithium 12 hydroxystearate, calcium sulfonate and clay-thickened greases. The test results are provided in Table 2.
| Number Tested | Average (PA) | 1 Sigma (PA) | |
|---|---|---|---|
| Lithium 12 Hydroxystearate | 41 | 797 | 105 |
| Calcium Sulfonate | 20 | 316 | 16 |
| Clay | 20 | 1,247 | 187 |
The clay- and lithium-thickened greases had a deviation of approximately 15 percent from the mean, while the third grease had a deviation of about 5 percent. The repeatability of the instrument was not stated. The differences found in repeatability are expected to be larger from in-service grease than from grease originating from a single batch of fresh grease. The non-linear aspect of the NLGI scale can be seen in the overlays shown in Figure 4. Grease with consistencies above grade 4 as measured by NLGI were not found in machines. The accuracy of the equation for data beyond NLGI 4 is unknown.
| Cone Penetration (mm) | Yeild Stress (PA) | Frequency Sweep 0.1 R/S (PA) | Frequency Sweep 1 R/S (PA) | Frequency Sweep 10 R/S (PA) | Frequency Sweep 100 R/S (PA) | |
|---|---|---|---|---|---|---|
| Kettle | 227 | 1,136 | 3,290 | 22,219 | 28,596 | 51,933 |
| Contactor | 292 | 871 | 7,669 | 10,304 | 13,974 | 19,737 |
Other Applications
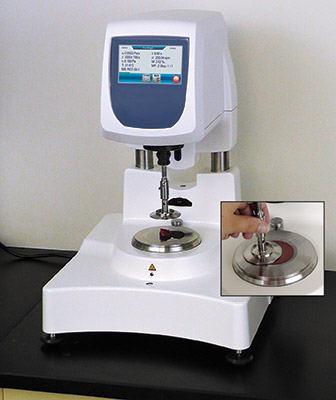 Not only can a rheometer be used to replace an arguably outdated industry test and with less sample and mess than cone penetration, but it can also be utilized with a variety of test methods to learn more about a grease.
As mentioned previously, variations within a grease manufacturer’s product label can and do occur. These are captured as part of a manufacturing tolerance, which includes instrument accuracy, and in the case of cone penetration, a range defined by the NLGI scale. However, the cone penetration test is limited and cannot be expected to determine if a product manufactured by a different process and under a single manufacturer’s label is truly the same or if significant fundamental differences may exist.
A recent study compared simple lithium grease manufactured from the same starting materials but with different manufacturing processes. The grease samples came from batches made with either a Stratco contactor or a kettle. These greases were manufactured as equivalents and compared well through several tests. Both were given an NLGI 2 classification.
Samples from these greases were then measured using rheometer techniques and a common rheometer test method defined as a frequency sweep. This method applies a constant stress between a fixed lower plate and an oscillating upper plate, beginning at 0.1 radians per second and ramping up to 100 radians per second at a constant temperature of 30 degrees C. The grease in this test is evaluated in a dynamic environment, and its response measured.
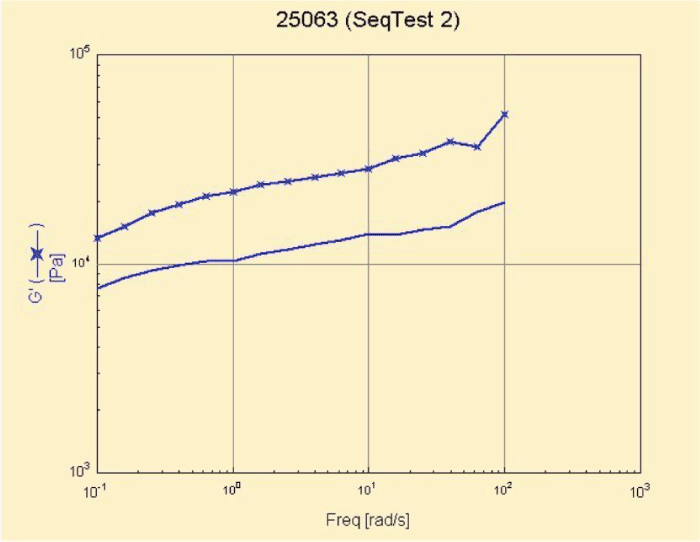 The samples from the kettle and contactor were tested for yield stress, cone penetration and frequency sweep. The data obtained is shown in Table 3. It should be noted that these samples are the same according to the NLGI scale but vary by nearly 25 percent based on the yield stress rheometer test.
Although described as similar, the greases tested in a very different manner. Under the defined test conditions, one grease appeared to have almost twice the elastic strength of the other grease. The magnitude of the G stresses measured for each grease was so different that an argument could be made that the greases were not the same and might be best suited for different applications. Without a discriminating test, the potential exists that these greases could be packaged under the same label. Indeed, this is likely to occur.
In conclusion, a rheometer has proven to be capable of providing data similar to cone penetration with better accuracy and test results in accepted scientific units. This avoids the use of a seemingly arbitrary scale that could easily cause users to make incorrect assumptions about a grease. In addition, rheometer testing can be performed with a very small sample, which is an important consideration when condition monitoring based on used grease samples is the objective.
