The Wrath of Unscheduled Downtime
Why Oil Analysis is a Wise and Effective Defense
There are 8,760 hours in a year. Few plants manage to produce at full capacity for all of those hours. Instead, there are periodic production stoppages due to tooling changes, product changes, scheduled PMs/inspections and unscheduled downtime (reliability issues). Every hour the plant’s assets aren’t utilized is an hour of lost revenue and profits.
< Sadly, many plant managers play games with the numbers by ignoring the potential controllability of “scheduled” downtime. Yes, tooling and product changes are unavoidable, but in most other circumstances, there are often practical ways to minimize lost production from scheduled shutdowns. This can be seen in the difference between typical and top performers in the same industry. For instance, a standard 900-megawatt coal-fired power plant may produce at 86-percent capacity (44 weeks per year), while top performers can exceed 94 percent (48 weeks per year). This is a difference of four weeks of productivity.
Still, no classification of work stoppage causes more agony than unscheduled downtime. The reasons are quite obvious, as a recent online survey of Machinery Lubrication readers discovered. Following is a list of the top reasons unscheduled downtime is so unwelcome:
- Production losses and schedule delays (business interruption)
- Lost revenue and profit (unhappy management/ownership)
- Promised delivery dates are missed (unhappy customers)
- The blame game and damaged relationships between operations and maintenance (morale issues)
- Hurried (botched) repairs cause future problems (cycle of despair)
- Lack of available replacement parts and skilled trades prolongs the downtime interval
- Repairs are at a “cost premium” due to rushed parts purchases, use of overtime labor and collateral damage
- Scheduled “proactive” tasks are replaced by chaotic reactive tasks (leads to future problems)
- Increased work pressure and job stress (job satisfaction issues)
- Safety risks due to rushed work, unskilled work, inferior parts, cutting corners, job stress, etc.
What Oil Analysis Can Do
It’s hard for a machine to fail without the oil knowing first. After all, when failures begin and progress over time, there is usually microscopic excavation of machine surfaces producing wear debris. Where does this debris go? It goes into the oil, of course. The oil is like a confessional for the machine. It gets all the bad news quick. For those trying to prevent unscheduled downtime by catching problems early, this is good news.
A few years ago Practicing Oil Analysis magazine featured two articles on the differences between vibration analysis and oil analysis in detecting machine faults and impending failure conditions. The articles, which can be viewed at www.MachineryLubrication.com, were written by vibration specialist Howard Maxwell and oil analysis specialist Brian Johnson from Palo Verde Nuclear Generating Station of Arizona Public Service. Palo Verde made a dramatic change in its approach to condition monitoring and machine reliability. The plant combined vibration analysis and oil analysis into a common group, brought its oil analysis onsite and began working as a team.
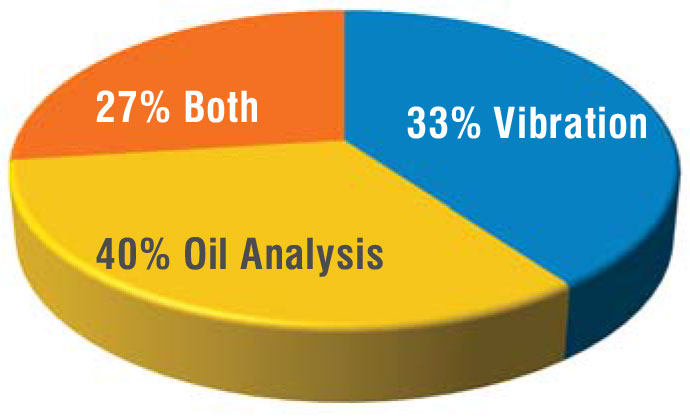
The pie chart in Figure 1 shows the impressive results. Of the 750 machines in the condition monitoring program, bearing faults were first detected 67 percent of the time using oil analysis and 60 percent of the time with vibration analysis. Both technologies converged to catch bearing faults 27 percent of the time. It was noted that while oil analysis caught the faults 40 percent of the time ahead of vibration, eventually vibration analysis would have detected many of these faults as the problems progressed.
In research conducted at Monash University in Melbourne, Australia, failure in gearboxes was induced under controlled conditions. These conditions included misalignment, oil contamination, tooth fracture and others. During the progression of the failure, the gearboxes were monitored using vibration analysis and oil analysis (ferrous density). At the end of the study, the researchers determined that, on average, oil analysis provided 15 times earlier detection of impending failure compared to vibration analysis. In the case of tooth fracture, oil analysis gave no alarm at all, while vibration alarmed quickly. They further concluded that both are important companion technologies for the best early detection results.
The Magic of Frequency and Detectability
It’s been said many times that early detection requires frequent detection. It doesn’t matter how good your technology is; its effectiveness is limited if used infrequently. Even the most basic and unsophisticated technologies can win the day when they are used at short intervals. An example would be smartly performed one-minute daily inspections. Smart frequency beats smart technology.
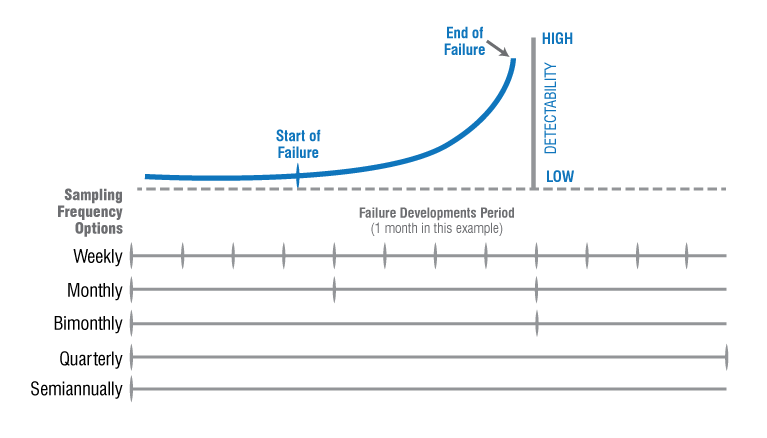
 This benefit is seen in Figure 2. The failure development period (FDP) is the time interval between the start of failure and the end of failure. In the illustrated example, the FDP time interval is one month. If failure detection methods (vibration, oil analysis and inspection) are performed less frequently than monthly, the chance of catching early faults is remote. Even monthly monitoring can fail to detect incipient faults due to limitations in alarming to weak failure signals.
As shown in Figure 2, the detectability of faults gets easier as failure advances. However, even silent alarms associated with incipient, early stage faults and failures can be heard when oil analysis and vibration analysis are performed with considerable skill. For instance, sampling machine return lines and keeping oil clean (to reduce data clutter) can sharply improve the signal-to-noise ratio to enable early detection of even the weakest signals. The earlier the detection methods are deployed, the less costly and disruptive the machine failure is to the organization.
What the P-F Interval Can Tell You
The smart money in machine reliability invests not only in frequent detection of faults and abnormal wear but also in frequent detection of root causes. Using the Pareto principle, you can concentrate efforts toward 20 percent of the root causes to gain 80 percent of the benefit. This is analogous to fixing the roof while the sun is shining. Correcting the cause of the leak is so much less expensive than correcting the damage caused by the leak (e.g., water damage to floors and furniture).
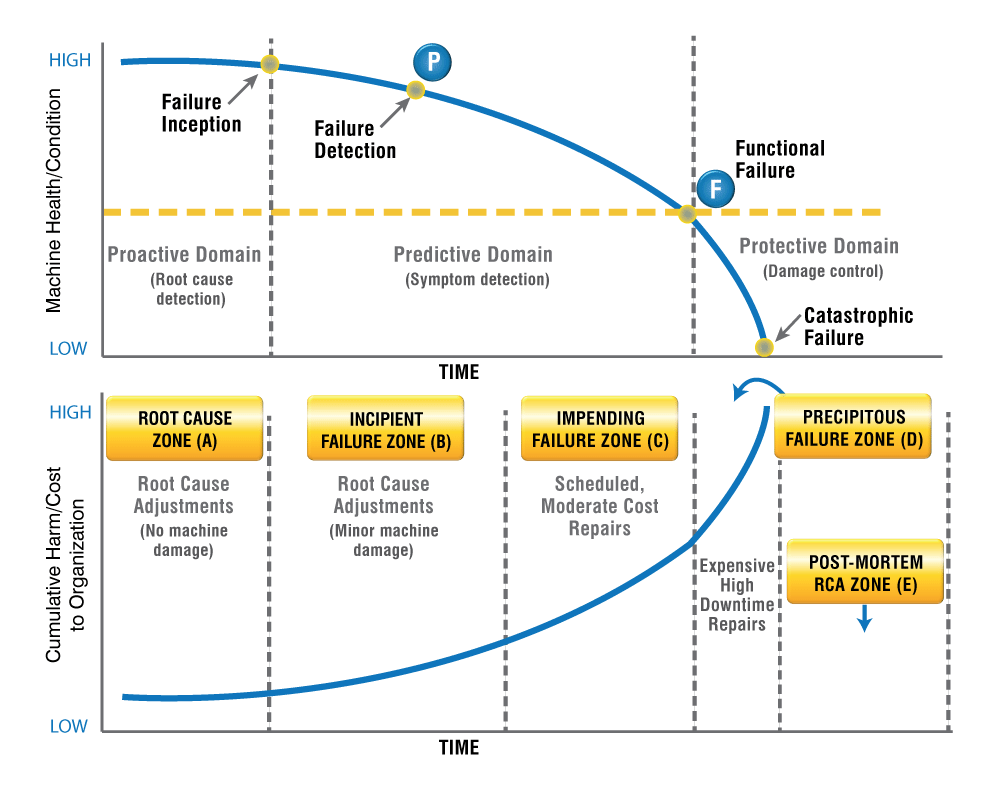
This concept is illustrated using the P-F interval in Figure 3. The proactive domain relates to vigilant monitoring and control of failure root causes (contamination, for instance). Corrections usually involve only minor adjustments (to remove the root cause) with no machine damage as shown in the root cause zone (A).
The onset of failure occurs at the beginning of the predictive domain. Ideally, it is detected early in the incipient failure zone (B). This requires high detection frequency and “pin-drop” detection technique (referring to condition monitoring techniques capable of detecting faint alarm signals). Once detected, the corrective action relates to root cause adjustments with only negligible machine damage.

If too much time passes and/or the detection methods are insensitive, you will enter the impending failure zone (C). Here, the cost of correction or repair is greater, but usually it can be scheduled with limited loss of production. The vast majority of predictive maintenance “saves” are in zone C. Both oil analysis and vibration analysis are excellent zone C technologies. When performed with considerable skill, daily inspections are extremely effective as well.
The Dreaded Unscheduled Downtime Zone
Unscheduled downtime occurs in the precipitous failure zone (D). This is not early detection, and the damage is unforgiving. Certain types of failures produce runaway conditions. In such cases, the FDP is too short for detection (sudden death). For new machines, this is called infant mortality. The costs of these failures can be enormous due to business interruption, collateral damage (chain reaction failures), high repair bills and the potential for personal injury. Precipitous failure is the inverse of machine reliability.
Next is the post-mortem root cause analysis (RCA) zone (E). Use failure as a teacher to discover what went wrong and how to prevent its recurrence. Also, learn the incipient signs of failure so the condition monitoring program (frequency and technique) can be refined accordingly.
What It All Means
Early detection doesn’t prevent failure. It does, however, do the following:
- Keeps failures minor (e.g., moderate damage, not catastrophic)
- Reduces risk of collateral damage
- Allows scheduled repairs and no unscheduled downtime
- Provides time to obtain spare parts and tools
- Provides time to find skilled trades to perform the repairs
- Provides time to schedule repairs with minimal production losses
- Provides time to inform customers of production delays
Early detection is aspiration-driven, not crises-driven. Yes, a crisis puts the focus on reliability. An expensive failure is usually the perfect time to bring awareness to the importance of condition-based maintenance and investing in lubrication-induced machine reliability. Don’t let a perfectly good failure go to waste. Take action now.
