Base Oil Report
Indian refiners are reducing their intake of Iranian crude oil in preparation for the return of U.S. sanctions on Tehran. Te reduction is being seen as an attempt to score a waiver from the U.S. Treasury Department. Loadings for September and October will be lower than 12 million barrels each month, which is nearly half of what they imported earlier this year in preparation for the sanctions.
India imports as much as 80 percent of the oil it consumes, which makes it more vulnerable than other importers to price swings. Tis vulnerability has, in recent months, been heightened by devaluation in the rupee, which has led to a considerable swelling in its oil bill. In August, government calculations revealed this bill could rise by as much as US$26 billion in financial 2018/2019 if prices remain high.

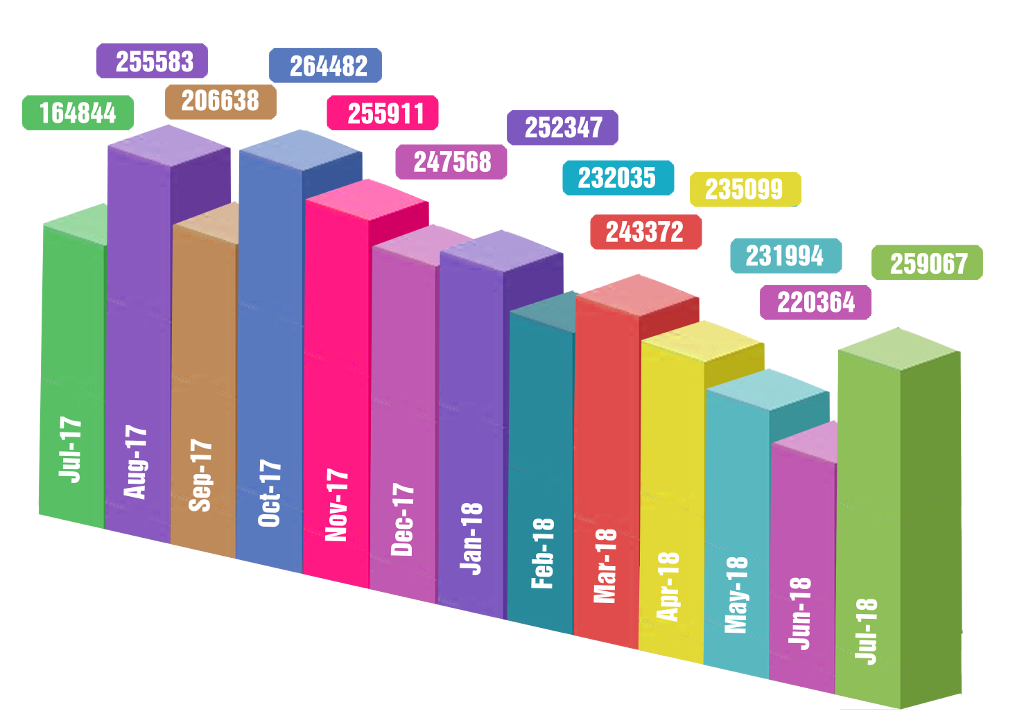
As per the data analysis, import of the country has gone up by 27% during Jan to July 2018, as compared to same period last year i.e. Jan to July 2017. Compared to June 2018, import of the country has increased by 18% in the month of July 2018. India import has gone up by 57% in July 2018, as compared to same period last year i.e. July 2017.
The Indian base oil market remains steady with inventories at optimum levels with surplus of imported grades. During the month of July 2018, approximately 259067 MT have been procured at Indian Ports of all the grades. Compared to last month i.e. June 2018, import of the country has increased by 18% in the month of June 2018.
In the month of July 2018, India imported 259067 MT of Base Oil. India imported the huge quantum in small shipments on different ports like 174181 MT (67%) into Mumbai, 27552 MT (11%) into Chennai, 27189 MT (10%) into JNPT, 12253 MT (5%) into Pipavav, 7282 MT (3%) into Kandla, 4696 MT (2%) into Hazira, 4440 MT (2%) into Mundra and 1474 MT (1%) into Other Ports.

| Month | Group I - SN 150 Iran Origin | Group II -J-500 Singapore Origin | N- 70 South Korea Origin | Bright Stock |
|---|---|---|---|---|
| July 2018 | 780 – 795 | 840 – 860 | 785 – 795 | 1195 – 1205 |
| August 2018 | 765 – 780 | 825 – 845 | 770 – 780 | 1180 – 1190 |
| September 2018 | 765 – 780 | 825 – 845 | 770 – 780 | 1180 – 1190 |
| Since July 2018, prices in September 2018 | Gone down by USD 15 PMT (2%) | Gone down by USD 15 PMT (2%) | Gone down by USD 15 PMT (2%) | Decrease by USD 15 PMT (1%) |
