Base Oil Report
India witnessed the highest increase in crude oil imports in the first four months (April-July) of the current fiscal year 2019-20 (FY20) from the US. India’s crude oil imports from the US tripled to 3.60 million tonne (MT) in the period from 1.15 MT recorded in the corresponding period a year ago. A bulk of crude oil shipments from the US was received by Reliance Industries port located in Jamnagar’s special economic zone (SEZ). India’s crude oil imports from Iraq increased 3 per cent to 16.05 MT in April- July of FY20. Nayara Energy-owned Vadinar Port was the second-largest receiver of Iraqi crude oil shipments in first four months of FY20, handling close to 3.08 MT of crude oil during the period. However, the port’s shipments of Iraqi crude declined 16.30 per cent during first four months of the current financial year, as compared to the corresponding period a year ago. India’s crude oil imports from Saudi Arabia increased 5.61 per cent to 13.34 MT in first four months of FY20.

 The Indian domestic market Korean origin Group II plus N-60–70/150/500 price at the current level is marginally down for lighter grades and heavier grades. As per conversation with domestic importers and traders prices for N – 70/ N- 150/ N - 500 grades and at the current level are quoted in the range of Rs. 44.75 – 44.90/45.30 – 45.45/50.75 – 50.90 per liter in bulk plus 18% GST as applicable. Discounts being offered for sizeable quantity.
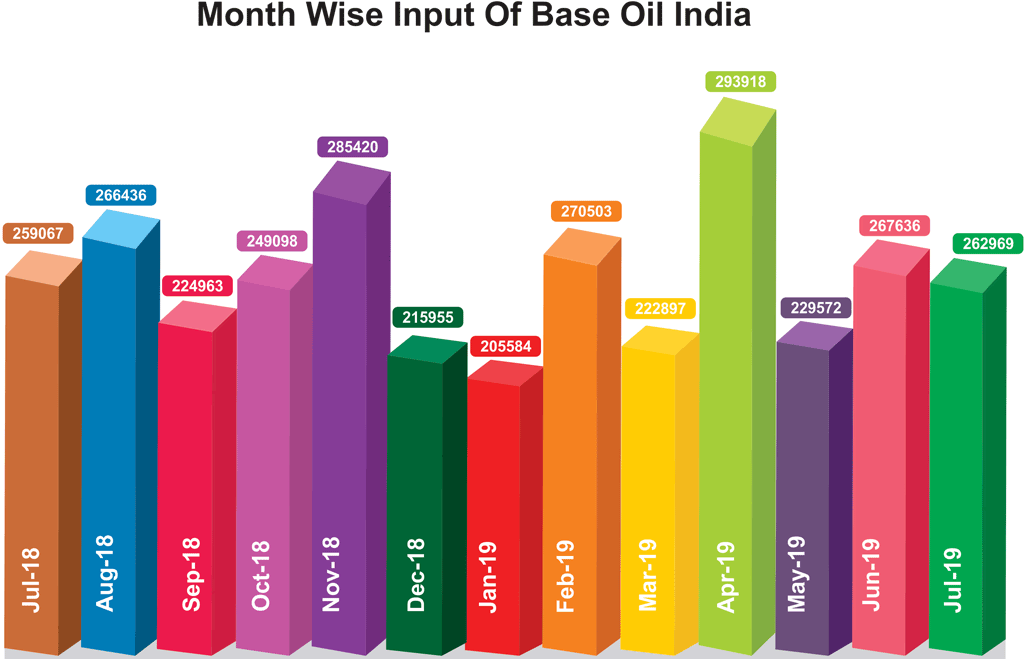
While in the month of July 2019, India imported 262,969 MT of Base Oil, India imported the huge quantum in small shipments on different ports like 151504 MT (58%) into Mumbai, 34385 MT (13%) into Chennai, 26742 MT (10%) into JNPT, 15012 MT (6%) into Kolkata, 11266 MT (4%) into Hazira, 8567 MT (3%) into Pipavav, 8222 MT (3%) into Kandla, 5017 MT (2%) into Mundra, 1676 MT (1%) into Ennore and 576 MT into Other Ports.
| Month | Group I–SN 500 Iran Origin | Naphthalene HyGold L 2000 US Origin | N-70 South Korea Origin | BrightRubber Process Oil (Aromatic Extract) (Drums) Iran Origin |
|---|---|---|---|---|
| Jul 2019 | 595–605 | 695–705 | 640–650 | 375–380 |
| August 2019 | 580–590 | 680–690 | 625–635 | 360–365 |
| September 2019 | 570–580 | 670–680 | 615–625 | 350–355 |
| Since Jul 2019, prices have decreased by in Sep 2019 (USD/PMT) | 25 (4%) | 25 (4%) | 25 (4%) | 25 (7%) |
