The Bathtub Curve Applied To Gearbox Oil Analysis What happens in the aging failure zone?
In recent years, the term “industrial revolution” has taken on new meaning, and many of those involved in the world of maintenance have taken notice of this transformation. The Fourth Industrial Revolution, characterized by the ongoing automation of traditional manufacturing and industrial practices, is yielding significant environmental and financial benefits, and it’s clear machine efficiency will continue to progress even further over the next decade.
This whole interconnected future sounds wonderful and has the potential to take us into a new world where machines emit almost zero waste and have the capability of communicating the precise moment they need attention. Surely that day will come, although for that we will have to cross many deserts and shipwrecks in unexpected places. Today, machines still suffer unexpected failures and millions of dollars are lost in downtime and whether in that marvellous new era to come or in the current one, machines will still age and will ultimately be replaced.
Those of us who have seen a machine/component fully degrade wonder what can be done to extract a few more service hours before the replacement. The most notable event of this type that I’ve experienced happened in the Bolivian highlands at an altitude of more than 13,000 feet above sea level. We only needed the machine to last 20 more hours (a little more than a day of operation) in order for the project completion costs to be kept to planned levels, but the oil leaks in the powertrain were nearly unstoppable. Using SAE 40 oil, consumption was over 50 litres per hour and the outlook was rather grim. It was at that moment that a senior technician, one who had lived through countless maintenance-related battles, decided to mix tar with the oil; the leaks were minimized and we reached the desired 20 hours needed to complete that part of the project.
Applying a chemically equal but higher-viscosity oil is a common solution when the machine is approaching its end of life, as doing so reduces wear, leaks and friction. Under most circumstances, it is necessary that a machine continues to operate under a regime as close to ideal as possible in order for the operating line to be maintained without causing losses or breaks in production.
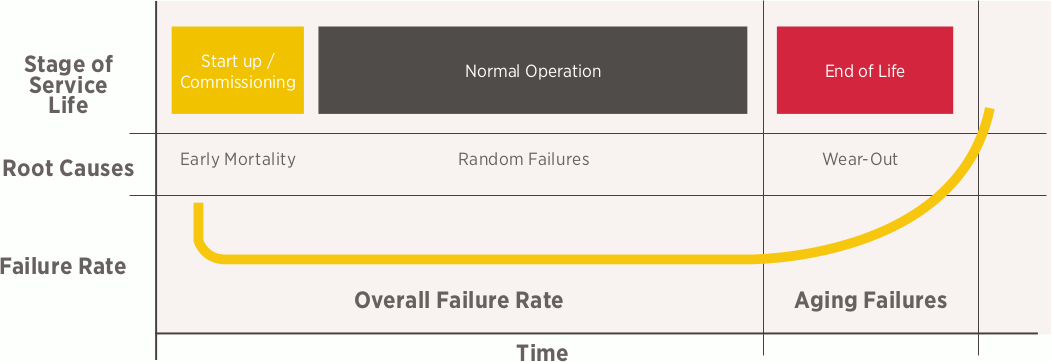
Bathtub Curve as a function of component wear in the form of a graph establishing the Stages of Service Life, Root Causes and Failure Rate for the entirety of a machine's life.

In the United States, the current average age of machinery depends on the industrial sector as well as its geographical location. There are sectors that come from an economic boom with an average machine age of close to ten years. However, at the other extreme are industries whose assets, such as gearboxes, began operating in the 1980s. In many cases, this machinery is under a predictive maintenance program that uses technologies such as vibration, thermography or oil analysis. When using oil analysis as a maintenance tool, it is relatively easy to set limits for component surface wear when the machine is in the flat phase of the bathtub curve. When we move to the sides of the curve, current data becomes less certain and it is very difficult to set those limits. In recent years, the bathtub curve has had a short and simple initial stage, meaning the machines undergo a short premature life and enter full performance quickly. Additionally, due to all the technology available, we have been able to extend the service life of the machines, anticipating potential catastrophic failures and healing injuries before it is too late.
At the other end of the curve in question, we can see that the effects of proper maintenance, advances in component improvements and control mechanisms on machines have allowed their service life to be extended as much as possible, although in many cases this has a downside to predictive maintenance itself. What reasoning should be applied in the ageing fault zone? Let's address this question using a case study.


Case study and field application
In 2016, with an approximate population of 80 gearboxes and good traceability of oil analysis reports as a maintenance tool, Industry “A” was aware that these machines were already close to completing their life cycle. Around 30% of this group of gearboxes showed signs of ageing wear and the subsequent unscheduled downtime was directly related to ageing failures. The remaining 60% showed evidence of following the same path as the previous group, and the last group did not show very aggressive signs of ageing. The Planning & Scheduling department estimated that it would take between 5 to 6 years to replace all machines with clear signs that they had entered the final stage of their useful life (90%). This meant that it would be necessary to control and extend the life of the assets for the 5 to 6 years it would take to replace them.
Within this scenario, all predictive maintenance tools would need to be used with an understanding of this stage in which the wear was high and the clearances of the machine had increased. This meant the critical limits of the machinery needed to be recalculated. The question is, how do we achieve new oil analysis limits according to the ageing state of machines like this? How do we ensure that these new limits will not have a negative effect on the machinery and will allow it to function as normally as possible without suffering unscheduled downtime?
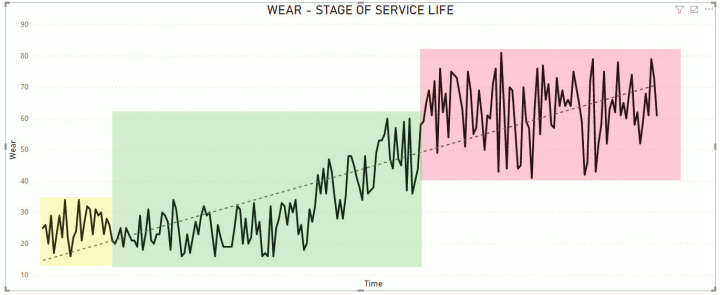
If we analyze the wear data measured as iron (Fe) throughout the service life of the most representative set of these machines, the 3 zones can be clearly observed from an operational point of view.
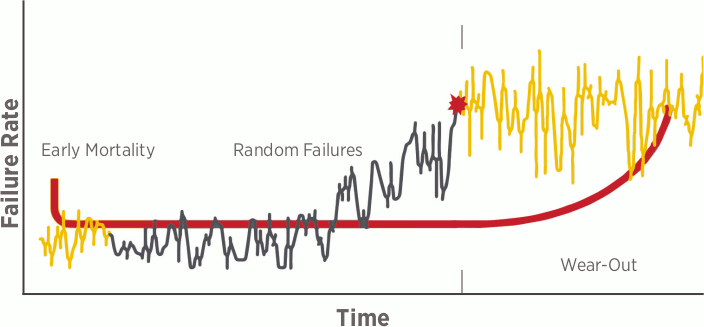
Superimposing the wear graph over the bathtub curve allows us to obtain an estimate of the most representative wear values measured as a function of time while also using the failure rate as a background, or what we consider closer to the gearbox potential failure that is part of this analysis.
So far we have laid the foundations necessary to demonstrate the benefits of oil analysis as a maintenance tool. If an adequate sampling frequency is followed and accompanied by a coherent analytical methodology, maintenance can take great advantage of this technique.
At the beginning of this article, we said that increasing the viscosity oil grade is one of the most applied practices if you want to keep equipment in service that has entered the last part of its service life. In the previous graph, the inflexion point where this practice is carried out can be seen and the high-risk zone is entered with the equipment still in operation. It is at the beginning of this inflexion that it is necessary to rethink the limit values from the wear point of view, taking into account that the previous values are no longer adequate. Although the viscosity of the oil has increased significantly, in some cases the loads and the oil might increase during operation as well.
| Element | Normal Operation | End of Life | ||
|---|---|---|---|---|
| Values | Limit | Values | Limit | |
| Fe | 34 | 60 | 76 | |
| PQ | 7 | 20 | 28 | |
| Cr | 2 | 4 | 5 | |
| Zn | 45 | 64 | 51 | |
| Cu | 3 | 5 | 12 | |
| Si | 12 | 25 | 28 | |
| P | 345 | 220 | 318 | |
| PC | 19/17/15 | 22/20/18 | 23/21/20 | |
| Element | Normal Operation | End of Life | ||
|---|---|---|---|---|
| Values | Limit | Values | Limit | |
| PQ | 7 | 20 | 35 | 67 |
| Cr | 2 | 4 | 6 | 7 |
| Zn | 45 | 64 | 51 | 76 |
| Cu | 3 | 8 | 12 | 21 |
| Si | 12 | 25 | 28 | 41 |
| P | 345 | 220 | 318 | 308 |
| PC | 19/17/15 | 22/20/18 | 23/21/20 | 24/22/20 |
There are a couple of statistical methods for determining the new critical limits for oil when equipment enters the last zone of the curve. However, to understand these statistics it is necessary to apply the knowledge that is obtained over many years of reading oil analysis reports, visiting sites and knowing the machine performance and working conditions.
Based on this set of variables, it is possible to determine coherent limits that once again allow those maintaining the machine to use oil analysis as a tool to respond with necessary corrective actions. To define the new limits for iron (Fe), the following information is required:
- Unit wear rate

- Average of the wear rate of the components analyzed and compared with a much larger database

- Comparison of distributions of the analyzed components and comparison with a much larger database
Thus, we obtain new critical limits for the end of the component's service life. Each of the elements represented in Table 1 and Table 2 has previous analysis not only from the statistical point of view but, as mentioned before, a comprehensive analysis from the point of view of lubrication and component wear. Each of these elements behaves differently and must be treated as such. For example, the variation and limits determined for an element such as iron (Fe), should not be applied to other elements, since their presence depends on the alloy or the type of component on which the analysis is developed.

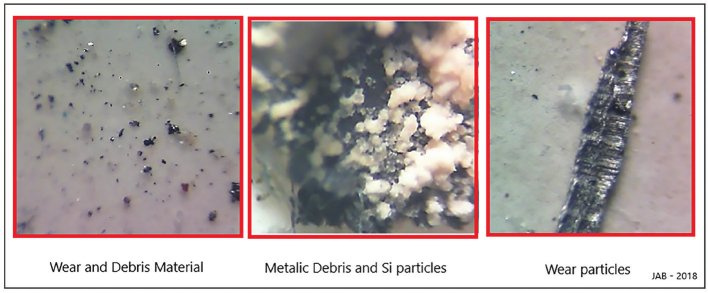
Additionally, it is important to take into account that the values reported as Particle Count (PC) does not refer only to the solid contamination that may exist in the oil at this stage but may also indicate the generation of wear particles, which play a much more important role. It’s also notable that solid contamination, measured as Silicon (Si), doesn’t appear to be of concern in this case since, in most of the analysis carried out under the microscope, it was observed that the Silicon particles are much smaller and less harmful than the metallic particles typical of component wear.
Once the critical limits for oil analysis have been determined, it is necessary to continue with the rest of the tasks related to the lubrication of the machines. Among these, the most important are:
-
Sampling frequency - In the flat phase of the bathtub curve, the sampling frequency was quarterly. In this case, the frequency is increased to bimonthly. It is possible to reduce some tests such as the water determination by Karl Fischer ASTM D6304 and TAN ASTM D664 to a less frequent interval, and only include these analyses in every fourth sample.
-
Filtration tasks - This is one of the most critical tasks during the ageing phase. It is necessary to take into account that the most significant change is the increase in size and quantity of the wear particles. This indicates that the consumption of filters is much higher, that there is much more solid material that the filter must retain and with an additional conditioning factor and that the viscosity of the oil has increased by at least one degree or even two degrees in some cases. This also implies that some filter carts that were already in operation probably need to be replaced or require some modification to be able to work with higher viscosities.
-
Desiccant filters - Due to the increase in clearances in certain parts of the machinery, it has been noted that the desiccant filters have reduced their service life by around 30%. This is quite logical, since increasing clearances allows moisture to enter more easily, contaminating the oil at a higher rate than normal and exhausting the desiccant material in the filter more quickly.
