Oil Analysis Interpretation for Gearboxes
Speed reducers, commonly referred to as “gearboxes”, are used in a variety of applications. Each application exposes the gearboxes to an array of loading and ambient conditions that directly affect the usable life. In order to prevent costly downtime or catastrophic failure of a gearbox, the industry has evolved to adopt condition monitoring as a mechanism for predictive maintenance.
Condition monitoring provides both historical and current performance data on the gearbox condition, thus providing a likely inference regarding the gearbox’s remaining useful life (RUL). Condition monitoring can guide predictive maintenance activities.
 There are several techniques that can provide a status of how the gearbox is performing. These techniques include temperature, vibration, noise and used oil analysis. While all techniques can be considered useful when checking the condition of a gearbox, one thing is certain for all techniques: it is all about trending.
This article will explain how used oil analysis can help determine the condition of a gearbox by learning the most important factors for used oil analysis, how to interpret the results of a used oil analysis report and how trending can help determine the schedule for preventive maintenance actions.
Considerations before Oil Analysis
Used oil analysis is a broad subject that includes several factors that affect the success of both interpretation and trending of used oil analysis results. While each factor can be broadly described when analyzed in-depth, a summary is provided to emphasize the importance of each factor.
1. Baseline oil sample

The first step to successfully trend the oil condition is to take a sample of the oil in an unused condition. This step is usually overlooked, and its significance comes from the fact that the user is able to establish a baseline of all the elements present in the oil in an unused condition. It can also help the user identify poor oil storage practices by checking if contaminants such as water are present.
Certain elements can either be additives, contaminants or wear debris. Having a sample of new oil helps differentiate between additives and contaminants. It aids in trending the depletion of additives, oxidation and changes in oil viscosity as the oil ages.
Oil manufacturers can be consulted to clarify if the elements present are part of a lubricating oil formulation or if they are a result of contamination or debris.
2. Sampling location
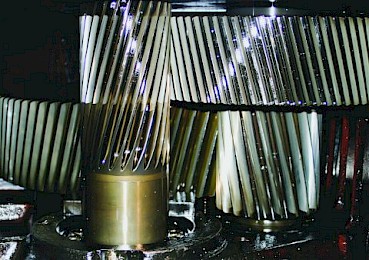
Critical to the analysis of oil conditions is the consistency in both time and location that the data is collected (Figure 1). Due to economic and resource variables, it is also important to focus on assets that are considered critical to the user’s operation. Location of oil sampling, e.g., the gearbox’s sump, will yield a statistically significant gauge that is repeatable and reproducible. Deviating from consistently sampling oil from the same point and operating conditions may result in discrepant data, and/or the data will be more difficult to trend.
3. Oil sample intervals
It is imperative that the oil is sampled at regularly scheduled intervals. This will allow consistent trending of the used oil sample results among multiple similar gearboxes, leading to more effective corrective actions.
Oil change intervals are usually established by OEMs. It may be possible to extend both used oil samples and oil change intervals depending on the application. However, care should be taken when doing so since the equipment may be damaged and/or machinery warranties may be voided. Maintenance professionals should be familiar with both gearbox conditions and applications before making this decision.
4. Representative used oil sample
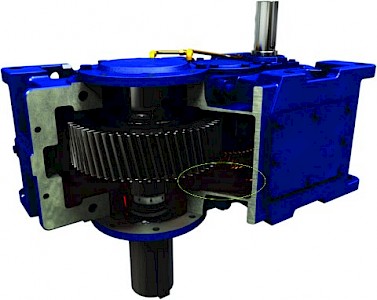
It is best to take a used oil sample while the unit is running during normal operating conditions after the unit has reached thermal stability where the oil has turbulent flow (Figure 2). Strict adherence to all safety guidelines should be followed when taking oil samples from any equipment in operation. Should it not be safe to do so, the oil sample should be taken immediately after the gearbox is shut down. Taking a used oil sample once the unit has cooled down or has been shut down for an extended period of time will not provide a representative sample, as contaminants will collect at the bottom of the sump. Also, when taking samples on sections where oil has a laminar (smooth) flow, the contaminants or wear particles shown in the oil analysis result may not be representative.
Recommended oil tests for gearboxes and interpretation
The following tests are useful to determine the condition of a gearbox, as well as to understand how the oil is affected by both the operation of the unit and application, including environmental conditions.
Viscosity
Description: Viscosity tests “indicate fluid’s resistance to flow at a given temperature,” usually measured and reported at 104°F (40°C). The units of measurement are reported in centistokes (cSt).
Interpretation: The viscosity of the oil is prone to change due to wear and chemical reactions. The results of other tests can be helpful to determine what happened with the oil during operation. As an example, an increase in oxidation trending levels could serve as a symptom that explains how the oil viscosity increased in the system. The possible causes of changes in oil viscosity are the following:
- Increased Viscosity: Oxidation, thermal failure, water contamination and wrong oil.
- Decreased Viscosity: VI improver (additive) shear-down, base oil shear-down, base oil cracking and wrong oil.
The Viscosity Analysis can help to determine if both the baseline and used oil are within specifications. For example, assuming that we have a gearbox that uses a lubricating oil with a viscosity of 220 cSt, the expectation is that the viscosity test result for that particular oil is within a 5% range of 220 cSt. As a reference, the most common designations according to ISO Standard 3448 are listed in Table 1. They are a good reference to compare the oil viscosity with the product we should be using for a particular gearbox, even though this reference applies to new oil only.
Oxidation
Description: “Signals the deterioration of the oil due to thermal breakdown and ageing causing a physical change in the oil.” Reported in absorbance per centimetre (Abs/cm), oxidation prevents additives from performing properly, promotes the formation of acids and increases viscosity.
Interpretation: While oxidation is a slow process that gradually degrades lubricating oils, it is known that the following factors influence the acceleration of oxidation:
| ISO VG | Mid-point Viscosity cSt @ 40°C Kinematic | Viscosity Limit cSt @ 40°C | |
|---|---|---|---|
| Lower | Upper | ||
| 100 | 100 | 90 | 110 |
| 150 | 150 | 135 | 165 |
| 220 | 220 | 198 | 242 |
| 320 | 320 | 288 | 352 |
| 460 | 460 | 414 | 506 |
- Temperature.
- The amount of oxygen in the environment.
- Water contamination.
- Metals (particularly copper and iron, which are usually worn metals) and organic and mineral acids promote oxidation.
Water content and wear metals directly affect oxidation, and can also be tested during used oil analysis, so it is helpful to relate these three tests while analyzing used oil results.
In general, “for each 10°C (18 °F) rise in temperature, the oxidation rate will double.” That being said, for high ambient temperature applications, applications that involve corrosive gases and high humidity and dusty environments, it is important to look at the rate at which oil oxidizes - these applications can be considered aggressive for lubricating oils. This would help schedule oil changes in predictive maintenance.
Acid Number (AN)
Description: “Measures the oil’s acidity representing a change in the oil. Indicates degradation of the oil in service leading to deposit formation.” “Reported in milligrams of potassium hydroxide per gram of test oil neutralized (mg KOH/g).”
Interpretation: In the baseline oil analysis result, it is likely to have a high initial AN value due to additives being slightly acidic. The AN will decline during operation as the additives are being depleted. But once the AN of used oil is higher than the baseline oil value, oil degradation has occurred. An AN above 4.0 means that the oil is “highly corrosive, risking an attack on metal surfaces.”
Also, testing for oxidation may be difficult for some synthetic lubricants because of infrared band interferences in some components; in these cases, Acid Number (AN) may be a more appropriate test.
Water Content
Description: “Determines the amount of water contamination - reported in percentage (%) or parts per million (ppm).” One per cent of water equals 10,000 ppm.
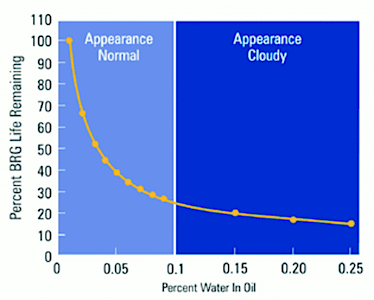
Interpretation: Minimizing water contamination is critical to the life of the gearbox. AGMA recommends having a maximum limit of 300 ppm (0.03%) of water contamination. If this value is compared to the remaining useful life of a bearing, as shown in Figure 3, this would mean that the life of a bearing is reduced to half of its useful life. Therefore, it is important to keep track of water contamination, especially in applications with high humidity or wide ambient temperature ranges that may result in water condensation.
| Category | Element | Class | Comments | |
|---|---|---|---|---|
| Wear Metals |
Iron | W,C | Usually found on reduction components and bearings. | |
| Chromium | W | Mostly found in bearings but can also be found on gearboxes with Cycloidal reduction components. Care should be taken when iron increases at a similar ratio as Chromium. | ||
| Nickel | W | Found in reduction components in very small quantities. | ||
| Aluminium | W,C | Found in greases as a thickener. Mostly considered a contaminant. | ||
| Copper | W,C,A | Usually found on bearing cages. Contact the Oil Manufacturer to ask if it's part of the additive package and/or compare with virgin oil analysis. | ||
| Lead | W | Considered a hazardous material. Not commonly found on gearboxes or lubricants. | ||
| Tin | W | Unlikely to be found gearboxes. | ||
| Cadmium | W | Unlikely to be found gearboxes. | ||
| Silver | W | Unlikely to be found gearboxes. | ||
| Vanadium | W | Unlikely to be found gearboxes. | ||
| Contami- nant Metals |
Silicon | C,A | Considered mostly as a contaminant. Even if found in very small quantities in reduction components, it is not considered as wear metal. Contact Oil Manufacturer to ask if it's part of the additive package and/or compare with virgin oil analysis. | |
| Sodium | C,A | Found in greases as thickener. Contact Oil Manufacturer to ask if it's part of the additive package and/or compare with virgin oil analysis. | ||
| Potassium | C | - | ||
| Multi- source Metals |
Lithium | C | Found in greases as a thickener. | |
| Boron | C, A | Contact Oil Manufacturer to ask if it's part of the additive package and/or compare with virgin oil analysis. | ||
| Titanium | W | Unlikely to be found in gearboxes. | ||
| Molybde- num | A | Not considered as wear metal even if it can be found in reduction components in very small quantities. Contact Oil Manufacturer to ask if it's part of the additive package and/or compare with virgin oil analysis. | ||
| Antimony | W | Unlikely to be found in gearboxes. | ||
| Manganese | W | Found in reduction components in very small quantities. | ||
| Additive Metals |
Magnesium | A | - | |
| Calcium | C,A | Found in greases as a thickener. Contact the Oil Manufacturer to ask if it's part of the additive package and/or compare with virgin oil analysis. | ||
| Barium | A | - | ||
| Phosphorus | A | Considered mostly as additive. Found in reduction components in very small quantities. | ||
| Zinc | A | - | ||
Particle Quantifier Index (PQ)
Description: “Measures the mass of ferromagnetic wear particles/debris in the oil irrespective of the size of the ferrous particles.” “Particle Quantifier (Ferrous Density) exposes a lubricant to a magnetic field. The presence of any ferrous metal causes a distortion in the field, that is represented as the PQ Index.”
Interpretation: “Although PQ does not provide a ratio of small to large ferrous particles, if the PQ Index is smaller than iron parts per million (ppm) by Inductively Coupled Plasma (ICP), it is unlikely there are any particles larger than 10 microns present. If the PQ Index increases dramatically while the iron ppm remains consistent or goes down, larger ferrous particles are being generated.” This means that there is a possible internal failure for the unit, such as broken reduction components.
Elemental Analysis by ICP
Description: Provides elemental metal analysis of up to 24 metals in the oil representing wear metals, additive metals and contaminant metals. Measures metals less than 10 µm in size and results are reported in ppm. The most common elements to be found on an oil analysis report are listed in Table 2.
Interpretation during trending: When compared to the baseline oil analysis, this can provide insight into either wear particles or contaminants in the oil. For example, during the break-in of a gearbox, the reduction components start to wear by removing asperities that are the result of machining and heat treatment processes. These worn asperities will affect the oil analysis result by increasing the iron particle count. This is common for most reduction components. When it comes to cycloidal reduction components, both iron and chrome ppm increase at a similar ratio since the material used on cycloidal reduction components differs from conventional gearing.
| Sampled | 08 Feb 2011 | 17 Sep 2012 | 21 Sep 2015 | 28 Sep 2016 | 21 Aug 2017 | |
| Reported | 12 Feb 2011 | 20 Sep 2012 | 06 Oct 2015 | 07 Oct 2016 | 30 Aug 2017 | |
| Contamination Rating | Normal | Normal | Normal | Normal | Normal | |
| Equipment Rating | Normal | Normal | Normal | Normal | Normal | |
| Oil Rating | ALERT | ALERT | Normal | Normal | Normal | |
| Lubricant | Diluted ISO Code (4/6/14) | 24/24/20 | ||||
| Particle Count (Diluted) >4um | 159411 | |||||
| Particle Count >6um | 117932 | |||||
| Particle Count (Diluted) >14um | 6415 | |||||
| ISO Code (4/6/14) | 21/19/16 | 22/20/15 | 22/21/19 | 22/21/18 | ||
| Particle Count >4um | 13296 | 22003 | 25845 | 28641 | ||
| Particle Count >6um | 3807 | 6649 | 18136 | 18317 | ||
| Particle Count >14um | 537 | 276 | 3164 | 1487 | ||
| PQ Index | 0 | 40 | 11 | 22 | 77 | |
| Visc @40C (cSt) | 136.7 | 158.6 | 205.8 | 210.6 | 219.3 | |
| Oxidation (Ab/cm) | 2 | 4 | 1 | 0 | ||
| TAN (mg KOH/g) | 0.83 | |||||
| Water (Vol%) | 0.013 | 0.018 | 0.007 | <0.003 | <0.003 | |
| ICP Wear Debris (ppm) | Al (Aluminum) | 0 | 0 | 0 | 0 | 0 |
| Cr (Chromium) | 0 | 1 | 0 | 0 | 0 | |
| Cu (Copper) | 6 | 0 | 0 | 0 | 0 | |
| Fe (Iron) | 35 | 135 | 45 | 57 | 96 | |
| Mo (Molybdenum) | 0 | 0 | 0 | 0 | 0 | |
| Ni (Nickel) | 0 | 0 | 0 | 0 | 0 | |
| Pb (Lead) | 0 | 0 | 0 | 0 | 0 | |
| Sn (Tin) | 0 | 0 | 2 | 0 | 1 | |
| ICP Contaminants (ppm) | K (Potassium) | 0 | 1 | 0 | 0 | 0 |
| Na (Sodium) | 3 | 6 | 1 | 0 | 0 | |
| Si (Silicon) | 1 | 4 | 8 | 6 | 17 | |
| ICP Additives (ppm) | B (Boron) | 2 | 3 | 2 | 3 | 1 |
| Ba (Barium) | 6 | 17 | 0 | 0 | 0 | |
| Ca (Calcium) | 39 | 23 | 0 | 0 | 1 | |
| Mg (Magnesium) | 2 | 0 | 0 | 0 | 0 | |
| P (Phosphorus) | 362 | 229 | 316 | 317 | 403 | |
| Zn (Zinc) | 344 | 8 | 2 | 1 | 1 |
It is important to be familiar with the elements present in both gearboxes and lubricants; doing so can help identify elements present in the oil in an unused state and which components are being worn out during the operation of the gearbox, allowing the necessary action to stop wear or replace potentially damaged components to be taken.
Case study: Chain Conveyor
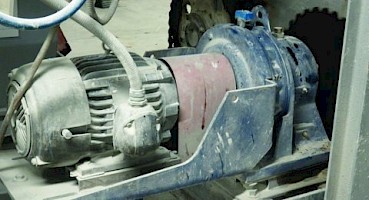
The gearbox in Figure 4 has been operating on a chain conveyor for around 10 years. The load depends on the type of product that is being handled (moderate to high shock load) and operates continuously for 24 hours, six days a week, with no starts and stops during operation.
The oil analysis results are shown in Figure 5. The following characteristics were monitored during oil analysis:
- Viscosity.
- Oxidation.
- Water content.
- Particle Quantifier Index.
- Elemental Analysis.
This case study excludes baseline data, and a target of 100ppm of iron was set by the end-user.
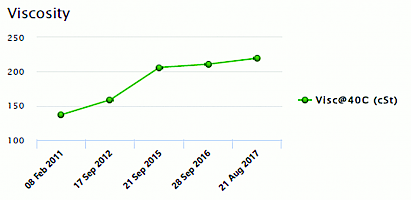
Regarding oil viscosity, it can be observed that the viscosity increased from around 150 cSt to 220 cSt. The trend can be observed in Figure 6. The reason is that the manufacturer’s recommendation is to use an approved oil with a 150 cSt viscosity. However, an unapproved 150 cSt viscosity oil was being used. After consulting with a lubricant specialist, it was decided to schedule an oil change and replace it with a 220 cSt viscosity oil, even though the oil used was not approved by the manufacturer.
It is important to point out that in this case, there is historical data in both oil analysis and application that backed the use of an unapproved oil, and with the help of a lubrication specialist, it was possible to find the right oil properties and viscosity to properly lubricate the gearbox. Even though a solution was found, it is a best practice to follow the manufacturer’s recommendation.
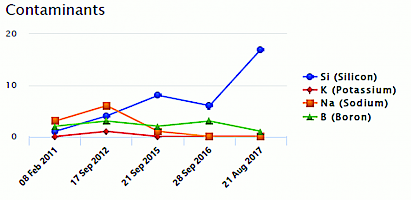
While using an unapproved 150 cSt oil, it can be observed that ferrous wear increased while having a low count on contaminants. This can be shown in both elemental analysis wear trend (Figure 7), contaminants trend (Figure 8) and particle quantifier index.
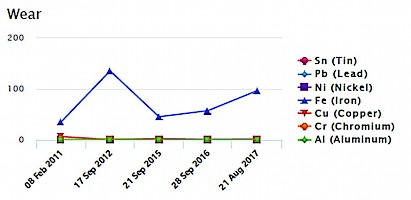
An increase in the iron count can be considered normal. It is the nature of a gearbox to transmit torque by the interaction between reduction components and variable loads that can increase the possibility of having metal-to-metal contact, resulting in wear. However, in this case, the ferrous wear exceeded the wear limit set by the end-user in one year, which can be considered as an abnormal increase of wear and resulted in scheduling oil change.
As both iron count and particle quantifier had increased, it is likely that reduction components are being worn out. Once the viscosity was increased to 220 cSt, the rate at which ferrous wear was generated was reduced by more than half, or in other words, the ferrous wear limit did not exceed the limit of 100 ppm in two years.
If both wear and contaminant trends are analyzed, it can be concluded that once the viscosity changed, the wear was generated as a result of contamination and less likely to be due to poor lubrication.
Both water content and oxidation affect the performance of the lubricant. Once these two characteristics are analyzed, it makes sense that ferrous wear was increased while using the unapproved 150 cSt oil.
In conclusion, poor lubricant performance affected by oxidation and water and use of an unapproved 150 cSt oil resulted in increased ferrous wear, even when the contaminant count was considered low compared to the rest of the trend. After consulting with a lubrication specialist and analyzing the data collected from condition monitoring and the application, the viscosity was increased, which resulted in cutting the ferrous wear rate by more than half and ensuring proper lubrication for the gearbox.
Conclusion
It is important to always compare the latest used oil analysis result with the new oil and previously used oil analysis results. The key to trending is knowledge of the gearbox, lubricant, application and environmental conditions, and how these interactions affect the condition of the lubricant and gearbox.
Unexpected downtime and gearbox replacement can be both costly and affect the operation of the facility. As a countermeasure, knowing and understanding used oil analysis for condition monitoring can be cost-effective, as this practice can help extend the useful life of both lubricant and gearbox through predictive maintenance. Note that the value of used oil analysis comes from taking action. It is important to take action every time an issue is identified during used oil analysis, whether that action involves changing the oil or overhauling a gearbox.
Bibliography
- Pirro, Don M., et al, “Lubrication Fundamentals”, Third Edition: Revised and Explained, Taylor & Francis Group, LLC, 2016, pp. 547.
- Fitch, Jim and Drew Troyer, “Oil Analysis Basics”, 2nd edition, Noria Corporation, 2010, pp. 121.
- Pirro, Don M., et al, “Lubrication Fundamentals”, Third Edition: Revised and Explained, Taylor & Francis Group, LLC, 2016, pp. 37.
- Fitch, Jim and Drew Troyer, “Oil Analysis Basics”, 2nd edition, Noria Corporation, 2010, pp. 84.
- Pirro, Don M., et al, “Lubrication Fundamentals”, Third Edition: Revised and Explained, Taylor & Francis Group, LLC, 2016, pp. 548.
- “Water in oil contamination”, Noria Corporation, https://www.machinerylubrication.com/Read/192/water-contaminant-oil
- “Particle Quantifier (Ferrous Density)”, Polaris Laboratories, https://www.eoilreports.com/testPopUps/particle-quantifying.htm