Scanning Electron Microscopy for Wear Debris Analysis

Oil analysis deploys various types of instruments, technologies, standards and techniques, all of which help provide a perspective on the health of the lubricant and the machine. The oil analysis data either target specific properties of the lubricant, quantifies the level of various contaminants or directly measures any evidence of mechanical wear through wear debris analysis. Many concerns arise anytime solid debris (particulates) of any kind accumulate in the lubricant within a machine.
On the one hand, if the solid debris is contamination-related, such as dirt or product debris entering the oil, this is a proactive (pre-failure) indicator that machine wear could occur as the debris becomes abrasive and disrupts the film thickness. While some amount of contaminant is expected, keeping this controlled is critical. On the other hand, if it’s wear debris related, composed of metals such as iron or copper, this is a predictive (progressive failure) indicator that machine wear is already occurring, and action should be strongly considered if a functional failure is to be avoided.
Monitoring for debris can be done in many ways. For example, daily visual inspection of the machine sight glasses or IIoT sensors can be the first indicator of abnormal conditions. Routine oil analysis can include tests to quantitatively look for particles in different ways, such as total particle size distribution (ISO particle counts), specific elements (ppm) or just ferrous debris (wear particle concentration), amongst others. All of these debris monitoring methods are great for initial detection and trending data. However, they each have their limitations and may not provide much investigative evidence on where the particles came from and how they were produced.
When abnormal trends arise during routine debris monitoring, it’s often necessary to prompt additional analysis (called exception testing) to answer some of these questions: What is the root cause? How threatening is the condition? What is the failure mode? How far has the wear mode progressed?
Even if a failure has already occurred, the remaining debris can shed light on what caused the failure and if it could have been avoided. These questions often require techniques with microscopic debris analysis to provide the answers. Crucial evidence to answer million-dollar questions about machine failure modes lies within the hidden depths of the particles.
What is Scanning Electron Microscopy?
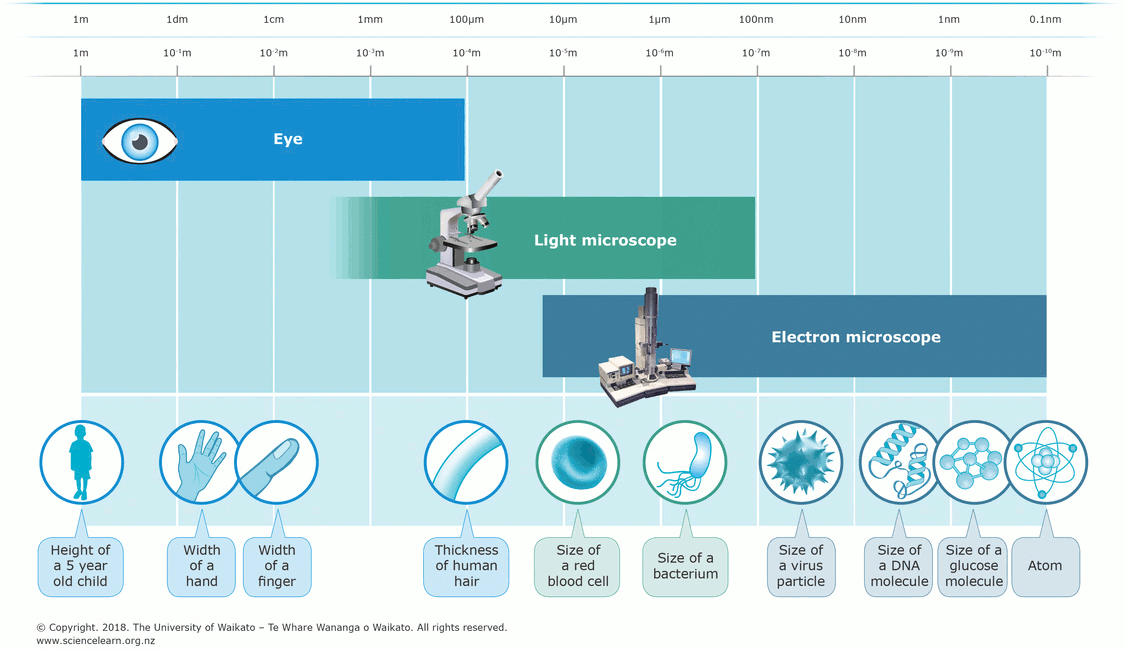
When observing an object, what we see with our eyes is the light reflected off the object. Our unaided eyes have a resolution; at about 100 microns (0.1 millimetres), we begin losing the ability to distinguish individual objects. Optical microscopes, which use lenses to focus light, allow us to see smaller features and objects.

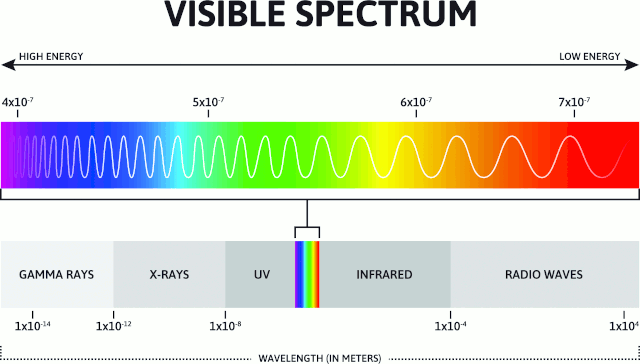
Light travels in waves with a specific wavelength, which is the distance that light takes to complete one oscillation. The wavelength of the visible light spectrum is between 400 and 700 nanometers (or 0.4 and 0.7 microns). As we attempt to magnify objects with an optical microscope, we encounter a resolution problem: the viewing area size of the object we are looking at becomes close to the wavelength of light. In other words, the image does not look clear, and we cannot distinguish individual features.
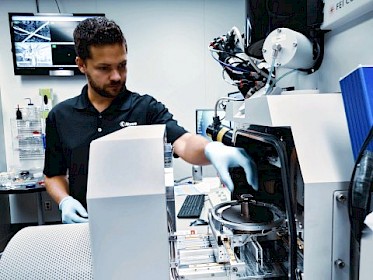
To visualize objects (or features on an object) smaller than the limits of the visible light spectrum, we must apply a different technology that uses a smaller wavelength, such as the Scanning Electron Microscope (SEM). Instead of light, an SEM uses electrons that travel with a much smaller wavelength (about 0.01 nanometers). An electron column focuses and shoots a beam of electrons at the surface of an object, often in a vacuum-controlled chamber. Detectors measure the electrons that are reflected off the surface or knocked out of the atomic orbitals near the surface of the material; this information is then used to generate an image of the material.
Because the SEM uses electrons to produce an image, the object being observed must be conductive. The electron column and specimen may need to be kept under a high vacuum in order to minimize interference of air molecules and other airborne contaminants during high magnification (greater than about 5000x). However, for analysis purposes that require the magnification of typical wear debris (2500x to 5000x), a low vacuum option (along with specialized laboratory techniques) can be used to more easily emphasize the particle’s characteristics.

In order to obtain SEM images of the particulate in an oil sample, the solid debris gathered from the oil sample (or elsewhere, such as a used filter) is collected onto a patch and, using a conductive adhesive, is adhered to an aluminium specimen mount. If sputter coating is used, a nanometer-scale layer of ions of conductive material is deposited onto the surface of the sample, creating a conductive pathway for the electrons. Common materials for sputter coating include carbon, aluminium and gold. Once the sample on the mount is prepared, it can be placed onto the SEM sample holder. The sample holder is on a movable stage which can be manipulated to different positions and rotations to help enhance observations of surface features as needed.
The resulting image will be monochrome (grayscale) since the objects are being observed with electrons, rather than how we observe colour within the visible light spectrum. The contrast in an SEM image can be caused by physical features, differences in atomic number between materials or differences in conductivity of the materials.
 SEM images of particles can appear differently from optical images of the same particles because the electrons will penetrate the surface of the material during imaging, rather than just reflecting off the surface like light waves. Operating conditions will affect the depth of penetration of the electrons. An electron beam with a lower operating voltage will have less penetration depth but will more clearly show surface features such as oxide layers.
Two major advantages of SEM over a light microscope are greater magnification and an increased depth of focus. Like a light microscope, the beam of electrons is focused more narrowly at higher magnifications, resulting in a clearer image but a reduced depth of focus. With an SEM, however, because the electron beam is narrower and has a smaller wavelength relative to light, it is often possible to get very high magnification and highly focused images of entire particles. Because of the larger depth of focus, we can see tall features and background features simultaneously.
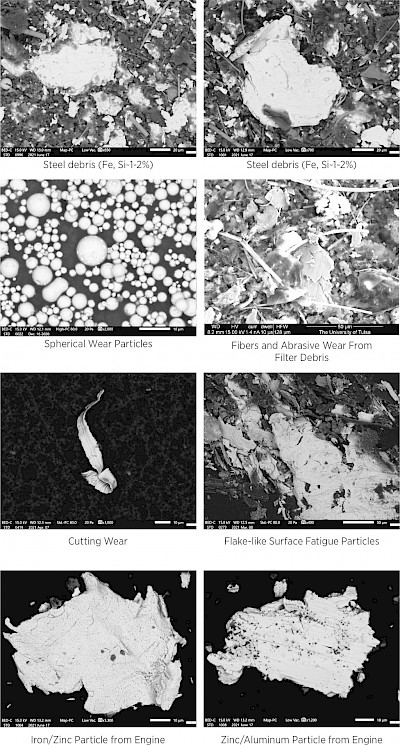
Scanning electron microscopy is commonly used for applications like failure analysis and particle analysis. Because the SEM provides images at high magnifications, we can quantify the sizes and topography of particles in the sample. The higher depth of focus allows us to image large particles and small particles in the same area simultaneously, giving a better understanding of particle size distribution. We can also observe features such as wear patterns or evidence of fatigue which will provide clues to the formation of the features.
Energy-Dispersive X-Ray Spectroscopy
In addition to the high-resolution images of very small surfaces and features with high magnification, the SEM is typically arranged with an additional technology that can determine the particle elemental composition - this is called Energy-Dispersive X-ray (EDX) or Energy-Dispersive Spectroscopy (EDS).
During an EDS analysis, the material of interest is bombarded with electrons. The incoming electrons knock existing electrons out of their orbitals and into higher orbitals. When these electrons fall back to their initial state, x-ray energy is released. Depending on the elements that are present, the energy that is released will have a specific wavelength. The detector quantifies the amount of energy released at each wavelength. EDS software matches the measured energies to specific elements that are likely to be present within the material, giving the user a qualitative list of likely elements and the relative amounts of those elements within the material. Elemental identification with EDS can be performed over the entire area on view in the SEM or on specific particles or areas within the sample. A more detailed analysis can identify the location of each element within the material.
When performing an EDS analysis, it is important to select operating parameters compatible with the material. Higher operating voltages are required for elements with higher atomic numbers. Because EDS functions in a similar way to the SEM, the specimens must also be conductive. For non-conductive materials, EDS analysis is possible on specimens that have been sputter coated, but the coating material will also be present in the results.
| Feature | Automatic Particle Counter | Analytical Ferrography | ICP Elemental Analysis | RDE Elemental Analysis | SEM/EDX |
|---|---|---|---|---|---|
| Sample Preparation Requirements | Usually | Yes | Yes | No | Yes |
| Particle Detection Range (microns) | 2-100 | 2-500 | <3 | <7 | 0.2-2,000 |
| Individual Particle Size and Shape | Usually | Yes | No | No | Yes |
| Total Element Chemical Analyses Range | No | No | 38 | 32 | 98 |
| Particle Classification by Chemistry | No | Limited | No | No | Yes |
| Particle Classification by Morphology and Chemistry | No | Yes | No | No | Yes |
| Analyses Time (minutes) | 5 | 10 | 3 | 3 | 10 to 30 |
| Ease of Use (1=easy, 5=moderate, 10=difficult) | 5 | 10 | 5 | 3 | 1 |
| Particle Size Distribution | Yes | No | No | No | Yes |
| Automated Trending | Yes | Limited | Yes | Yes | Yes |
Answering the Questions
With detailed images provided by the SEM and elemental data of specific wear particles provided by the EDS, interpretation can answer the crucial questions. A trained lubricant analysis technician can observe the topographical characteristics of each particle to determine which wear mode produced them and the severity of the wear event. The elemental composition and concentrations provide clues as to their source or formation. Unlike traditional elemental analysis (such as with inductively coupled plasma, ICP), which cannot easily analyze particles greater than about 3 microns, SEM/EDS techniques can easily provide elemental data on surfaces of particles of any size.
With SEM/EDS, particles can be categorized by their shapes, sizes and elemental composition, with minimal limitations to particle detection range and greater chemical and topographical determinations. In a chart published by Susan Benes in Machinery Lubrication Magazine, the SEM/EDS is compared against the other common particle counter and elemental analysis technologies.
While each technology has different intentions in reporting, the combination of techniques is crucial in creating conclusions on wear debris characteristics. SEM/EDS has been increasingly more available and easier to use in recent years, bringing it more into a standard practice for oil analysis. Many use SEM/EDS, along with other advanced wear debris monitoring techniques, to periodically analyze filter debris or other collected debris oil samples. The cost of failure could be too great for these questions to be left unanswered. Making the decision to use SEM/EDS analysis for your sample may be situational, specifically with problem-solving. A few reasons may include:
- When the originating source (wear surface) of unique particles exhibiting advanced wear must be known (matching the elemental composition of the particle with the known metallurgy of the machine).
- When the type of harmful contaminants must be known.
- When more precise particle images are needed to better understand the wear mode(s).
- When elemental analysis from ICP or RDE is unable to accurately quantify the elemental concentration of large contaminant and wear debris particles.
To learn more about the SEM/EDS technology and read case studies on the applications with oil analysis, visit machinerylubrication.com
Acknowledgements:
- This work made use of the Nano Characterization and Fabrication Laboratory of the University of Tulsa.
- The contribution provided by Fluid Life for their expertise in Scanning Electron Microscopy is related to Wear Debris Analysis.
