Sampling Toward a Sustainable Future
 Discover how maintaining proper machine lubrication by reducing contamination and increasing oil cleanliness through oil sampling, oil analysis and filtering can help you achieve machine efficiency and improve your facility’s carbon footprint. Why? It’s simple: Efficient machines consume less energy and oil.
Introduction
Climate change is an important discussion in the news and on the financial pages. Earlier this year, the United Nations published a report that unequivocally recommended rapid and significant changes in resource consumption. The report states that “observed increases in well-mixed greenhouse gas (GHG) concentrations since around 1750 are unequivocally caused by human activities,” and that “in 2019, atmospheric CO2 concentrations were higher than at any time in at least 2 million years [1].”
Increasing carbon dioxide and pollution levels have been identified as major contributors to these changes. Rising temperatures around the world have resulted in out-of-control forest fires destroying trees. Additionally, melting polar ice and rising water levels are causing erosion and threatening coastal towns and cities.
Public opinion and governments are responding. Corporate objectives are being rethought to align with investor and government objectives. For example, this summer, several environmental activists were elected through proxy votes to the board of Exxon Mobil. McDonald's is close to achieving its goal of sourcing all of its paper food packaging in restaurants from recycled or sustainable fiber, and A.P Moller-Maersk is gearing up to run its first carbon-neutral ship in 2023. These are just some examples of how major companies are setting goals towards reducing their carbon emissions.
How can companies move to both a more sustainable and profitable future? By creating a company-specific sustainability plan as a grassroots approach that would be welcomed by the community and investors alike. A great place to start is to revisit their lubrication program.
Maintaining oil cleanliness is vital to the performance of lubricated equipment. Oil contamination accelerates the rate of component wear and leads to premature component failure. In a globally competitive market, companies that can maintain machine reliability and uptime will be able to keep their costs at a more competitive level. These more efficient machines will consume less energy, and companies will be able to see monetary savings while running a greener operations.
The Greener Savings
Investing in oil analysis and improved oil sampling will help you achieve a greener machine by:
- Extending equipment life
- Improving equipment functioning
- Reducing unnecessary maintenance
- Reducing consumption
Extend Equipment Life
Extending out equipment’s life simply keeps equipment and waste out of the landfill. Landfills are full of equipment and their components that have been neglected, often simply due to poor lubrication. Each buried piece of equipment has used resources throughout the supply chain. You can extend your equipment's life by cleaning your lubricants. In fact, by cleaning your lubricants by as little as one ISO cleanliness code, you can provide a 35% increase in equipment life.
What is an ISO cleanliness code? ISO 4406:21 is the reporting standard for fluid cleanliness. A code number is assigned to particle count values derived at three different micron levels: greater than 4 microns, greater than 6 microns, and greater than 14 microns.
The Noria Life Extension Chart demonstrates the relative life of a component based on its cleanliness. Let’s take hydraulic systems as an example - if you improve oil cleanliness levels from an ISO 21/18 to an ISO 15/12 (as demonstrated in Figure 1), component life can be increased by a factor of 5 [2]. It is important to remember that actual savings will vary depending on lubricant performance, oil sample frequency, equipment type, equipment condition and previous condition, and the ability to keep the fluid clean.
There was a chemical manufacturer who installed condition monitoring equipment onto their gearboxes to meet the facility cleanliness targets of ISO 16/14/12 or better. As the reports came back, they noticed a gearbox was trending higher iron levels. They realized this was due to the gearbox operating outside its original design envelope. While they still had to order a replacement gearbox, they were able to make the necessary adjustments to prolong the remaining life to bridge the replacement lead time. Because the gearbox was still in operating condition, they were able to relocate the gearbox to continue its use.
| INITIAL ISO | 2X | 3X | 4X | 5X | 6X |
|---|---|---|---|---|---|
| 23/20 | 20/17 | 19/16 | 18/15 | 17/14 | 17/13 |
| 22/19 | 19/16 | 18/15 | 17/14 | 16/13 | 16/12 |
| 21/18 | 18/15 | 17/14 | 16/13 | 15/12 | 15/11 |
| 20/17 | 17/14 | 16/13 | 15/12 | 14/11 | 13/11 |
| 19/16 | 16/13 | 15/12 | 14/11 | 13/11 | 13/10 |
| 18/15 | 15/12 | 14/11 | 13/10 | 12/8 | 12/8 |
Improve Equipment Functioning
You can also evaluate the equipment’s energy efficiency by tracking its production output. For example, if a machine is capable of producing a certain number of parts in a given amount of time and after proper lubrication and monitoring practices are implemented, it can produce a higher volume of parts in the same amount of time, then the machine has become more energy efficient.
During times of supply shortages, improving equipment performance can have a significant impact on a company’s profitability. Here is an example of how to document performance improvement. These cases can be invaluable when determining which projects return the best value.
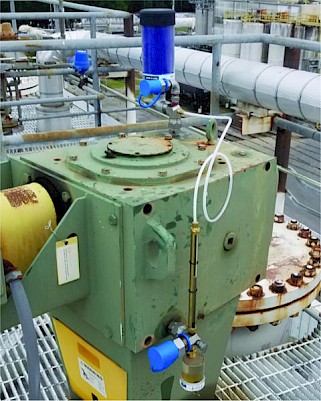
For example, by installing condition monitoring equipment, a plastics manufacturer was able to reduce machine contamination, improve oil cleanliness and increase machine productivity by sampling and filtering on the fly.

Reduce Unnecessary Maintenance
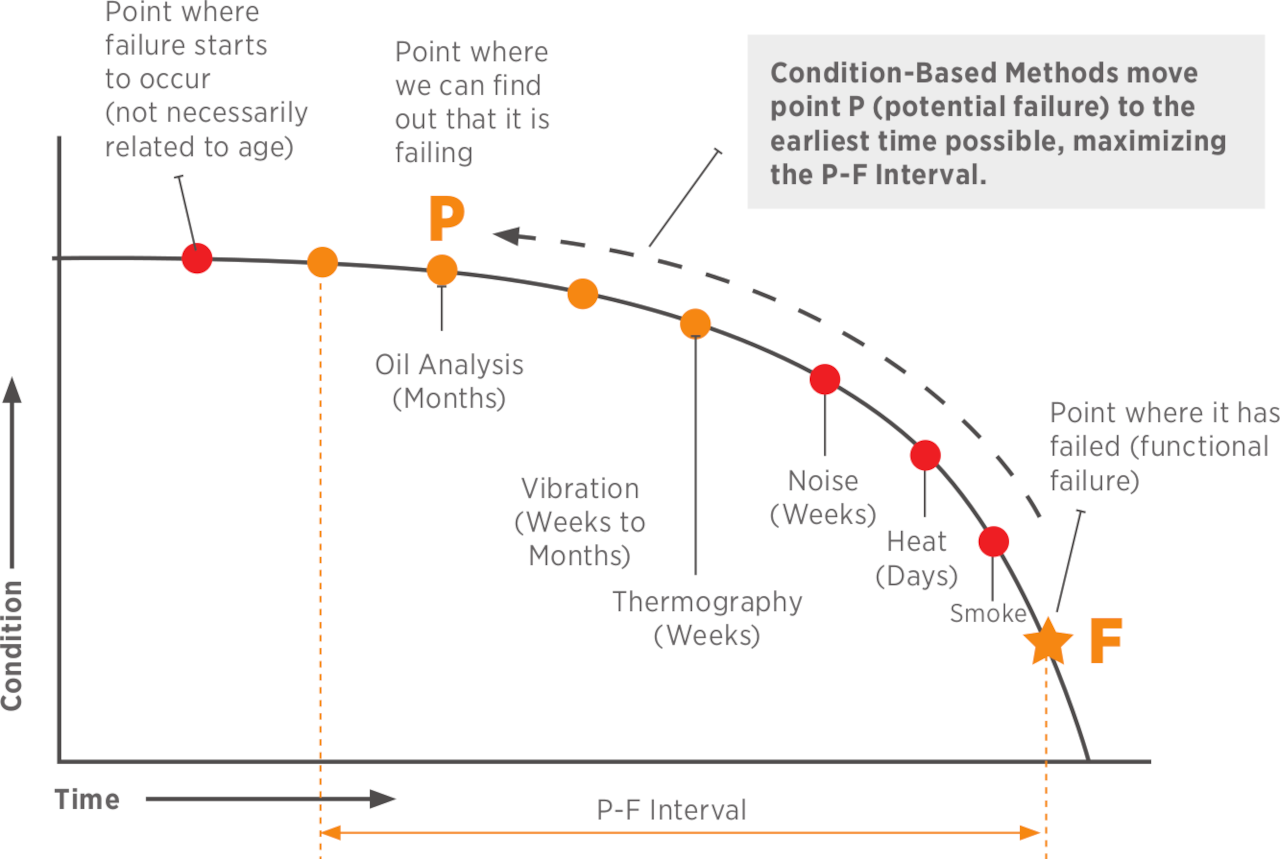
Oil analysis is one of the earliest predictors of impending machine failure on the PF Curve. The PF Curve represents the behaviour of an asset or component before function failure has occurred. The P-F interval may vary, lasting days, weeks or months, depending on the equipment’s condition. When used effectively, it can provide a significant amount of time between the latest inspection and functional failure to prioritize, plan and execute the necessary maintenance activities before the failure occurs. Machines can still run after failure has begun, but once an incident occurs, it is only a matter of time before the machine fails.
A mature oil analysis program can sample and analyze suspended particles in lubrication oil and then reveal specific individual component wear early in the deterioration phase. As we saw in the earlier example, early detection allows for the necessary parts to be obtained and the development of a restoration plan to rebuild a component before complete failure.
Typically, this knowledge can be invaluable when considering what maintenance is really necessary and avoiding crises with scheduling and shutdowns. In these times, with fewer people doing more work, unnecessary maintenance is not sustainable in the long term. However, sometimes due to improper oil sampling, these reports can be misleading. Improving oil sampling methods can improve the accuracy of these reports. Take these cases into consideration:

A pulp and paper company found their oil analysis results on a pump set frequently came back with high particle counts; their solution was simply to replace the pumps - an $8,000 cost. A new reliability engineer hypothesized that their sampling method might be the cause behind these high counts, as they were just drop-tube sampling from the breather port on the shared reservoir. It was decided to install sampling valves separately on each pump so they could tell which pump might be failing. They also added filtration so that high particle counts did not contribute to further deterioration or replacement of the pump. These changes resulted in reports that no longer showed high particle counts, saving them from replacing perfectly functioning pumps.
A marine company in the Pacific Northwest suspected a problem when their main engine’s oil analysis report continuously came back indicating coolant was in their system. They would drain the engine, inspect and see nothing wrong; this would cost them $3,000. It was not until they switched their sampling method to the Checkfluid LP & KP Pushbutton valves that the real problem was discovered. The technician taking the samples was using the same plastic tubing when he sampled the coolant and then the engine, leading to cross-contaminated samples.
Reduce Consumption
By upgrading your lubrication program, you will most likely see a reduction in the machine’s energy and oil consumption. These reductions will oftentimes give companies the biggest return on investment and the biggest demonstration of carbon reductions.
The carbon credit system being proposed is intended to discourage, where possible, carbon products like oil from adding to the CO2 in the atmosphere. As we saw in a recent United Nations short report on climate change, science is telling us that CO2 acts as a blanket like a greenhouse. The more CO2 that blankets the atmosphere, the more the sun’s rays will heat the planet and cause climate and ecosystem disruption.
The carbon credit is a way of keeping score. Whether it is part of a company, national system or international system, the carbon credit is used to fund initiatives that reduce CO2 emissions. These initiatives can be entirely local or, in the case of multinational companies, can be international.
For example, Shell in Canada offers consumers, when they fill up with gas, the opportunity of contributing two cents per litre to offset their carbon footprint. Unfortunately, politics can get in the way of taking action. Our objective should be to make our department or company carbon-neutral.
First, let’s look at oil consumption. Did you know that each gallon of lubricant consumed contributes to 23.6 pounds of CO2 emissions [3]? This means that a 55-gallon drum contributes to approximately 1,300 pounds of CO2 emissions. A carbon credit is equal to 1 ton of CO2, or approximately 85 gallons (320 litres) of oil. Using the current system, carbon neutrality would cost a company a $35 surcharge for consuming 85 gallons of oil. But by actually reducing oil consumption by 85 gallons, a company can save approximately $640 based on a $2 a litre/quart price of oil. It pays to optimize your drain interval.
Here is an example: A company-wide KPI for a plastics manufacturer was to reduce carbon emissions by reducing lubricant waste. For them to optimize drain intervals on their machines, they installed condition monitoring hardware and looked at in-service filtration.
From 2017 to 2018, the company increased the amount of oil they were able to filter and retain in their machines by 27.4%. They were able to reduce their CO2 emissions from wasted oil from 22,533 pounds of CO2 in 2012 to 3,779 pounds of CO2 in 2018, an 83% decrease in emissions by optimizing their drain intervals. This company was also able to save thousands of dollars in oil disposal costs.
Let’s talk about fuel consumption. Reducing fuel consumption in mobile equipment can be the most significant contribution to reducing CO2 emissions. Many of these strategies are outside of the scope of this article, but they include:
- Burning low sulfur fuels
- Reducing unnecessary trips
- Keeping tires inflated to correct levels (especially important for on or off-highway trucking)
Oil viscosity can also play a role; moving a thicker fluid takes more energy. If you reduce viscosity, less energy is consumed in the moving parts and in pumping the fluid around the engine. But at a lower viscosity, base oils are more volatile and likely to evaporate; you need the additives to work a little harder. To reduce fuel consumption and emissions, oil analysis and proper oil samples are vital to make sure the engine oil is clean, the viscosity is correct and the additive levels are good.
Next up is a reduction in electrical consumption as energy savings can be looked at in terms of what is used to operate the machine. An efficient running machine will use less energy than its counterparts. For an electric motor and/or gearbox, this would be a reduction in electric energy (voltage, current and power factor). Tracking electrical consumption is a reliable way to document energy efficiency improvements regarding changes in a lubrication program. Studies have seen that, typically, companies that upgrade their lubrication and reliability practices have been able to document a 5-15% reduction in power requirements [4].

Another interesting way of measuring improvement on a day-to-day basis is tracking the machine’s operating temperature. Proper lubrication and monitoring can reduce the friction between two surfaces, and thus, the amount of energy needed to move those parts against each other. When that friction is reduced, less electricity is required to operate the machine. Although it's unlikely to reveal the amount of energy saved, there will be a clear indication of the reduced energy consumption.
What You Need to Do
Making changes to your lubrication program will help move you and your company towards a more sustainable future. To start, you need to invest in good lubricants. More and more people are becoming aware that often the advantages of synthetic oils greatly outweigh the initial added cost. Remember to check and double-check with the manufacturer and your lubricants distributor to ensure that the right oil is in the right machine.
Then, you need to invest in a good oil analysis program. An oil analysis program with condition-based maintenance is one of the best strategies that can be used to maintain lubricated equipment. Through oil analysis, companies can monitor oil health, contamination and machine wear. When abnormal conditions are identified, immediate action can be taken to correct or negate a developing failure. Oil analysis labs can provide a tremendous staff resource with the expertise to uncover changing equipment health along with the expertise to suggest the appropriate corrective actions.
Your oil analysis result will only be as good as the sample you submit. This is why the importance of oil sampling cannot be underestimated. Labs often report that over 20% of the samples submitted are not representative of the system.
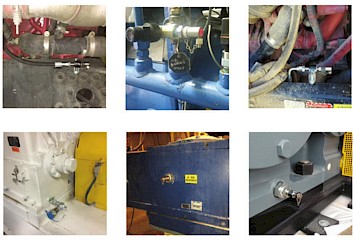
Dedicated oil sampling valves make it possible to take reliable oil samples safely while the equipment is running. This ensures that the sample is a direct representation of the equipment’s condition. The location of the sampling valves guarantees that the sample pulled will contain hot, information-rich oil that can be trended against previous samples to show the condition of your equipment. Lastly, sampling valves typically can collect the sample in a faster and cleaner way compared to other sampling methods.
Proper Sampling at All Stages
Start right. Starting with clean new oil that meets the OEM specifications will ensure you’re not introducing harmful particles to your system. At a minimum, you should ensure that the oil received is clean and is the correct viscosity. While several companies now offer their oil at a certified level of ISO cleanliness, it is still important to inspect and filter the oil as necessary before putting it into service.
Drum and tote mounts like Checkfluid’s DT adapter will enable you to sample, monitor, filter and cleanly transfer your oil from a storage container. The quick-connect (ideally flush face style) will let you cleanly connect your drum tote mount to your filtration system. A high-flow sampling valve option allows you to continually check on your oil without opening the drum to external contamination. The optional desiccant breather provides additional protection from moisture and particulate contamination without opening the system to dirt or moisture.
To sample in-service oil, look at installing sampling valves. Dedicated valves can be installed on most lubricated systems, such as gearboxes, hydraulic return lines, compressors, engines, etc.
Incorporating condition-based monitoring tools with your oil sampling valves will only help you increase program savings. Condition-based monitoring versus time-based monitoring enables a company to complete necessary maintenance when it is needed rather than when it is scheduled. This condition-based monitoring system (CBM) is at the heart of newer international standards for asset management, such as ISO 55000.
To incorporate condition monitoring tools into your oils sampling program, look at solutions such as Checkfluid’s CORE Solution. It is comprised of a breather mount and drain mount. With the CORE Solution, you can:
- Establish cleanliness requirements for all equipment
- Establish guidelines for incoming lubricants
- Get best practice oil sampling
- Baseline your oil
- Perform in-service filtering through a closed system when required
- Complete visual oil analysis inspections
- Protect your system from particles and moisture contamination
- Complete clean oil top-ups
- Drain your oil
As always, controlling contamination is a top priority. It continues to be one of the biggest causes of component failure and productivity declines. It is estimated that it costs 10 times more to remove contamination from equipment than to exclude contamination altogether. Remember, machine problems can be kept to a minimum with good oil and good oil plans.
With a better lubrication program, you can be sustainable and profitable at the same time.
