The Power of 10X Cleaner... Dryer... Cooler... Better Aligned... More Training
Have you ever considered how we might be rewarded if we improved something by 10 times? For instance, what if we were 10 times richer; would we be 10 times happier? How about if we were 10 times smarter; would we be 10 times more successful? What if we worked 10 times harder? How might it apply to being more physically fit, taking initiative, having more drive, being kind and more empathetic, having more friends/connections, etc.?
One might think that if you make a 10-times improvement, you should expect a 10-times gain. In such cases, your gain or benefit would be incremental or proportional. In maintenance, we have control over many factors that can lead to gain. We’ve all heard of the gains that are the most important to us: better quality, lower production costs, lower repair costs, higher asset utilization, improved safety; the list goes on.
Invariably, we are looking for factors within our realm of control, factors that we can affect with relative ease and sustainability.
We have so many options at our disposal. What do we choose, and what do we push aside? Understandably, if we are going to change something, we’d want the biggest bang for our buck.
To that end, I have prepared a list of options to consider where we have good data and/or experience to rely on. Let’s get started.
10X Cleaner
This one is easy; the contaminant sensitivity of machine components has been reasonably well-established. This includes bearings, gearing, pumps, valves and even engines. A test procedure, known as the accelerated life test (ALT), is followed to determine a machine’s tolerance to particle contamination. During the test, the machine or component is subjected (exposed) to known and controlled levels of contaminants to measure changes in service life.
Of course, there are a lot of factors related to particles that influence service life. These include particle size, number, hardness and angularity. We must also consider machine and operating factors: loads, speeds, working clearance, metallurgy/surface hardness and contact geometry.
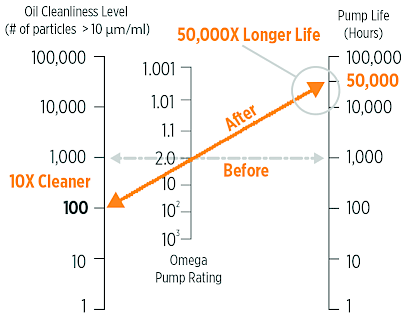
With rare exceptions, the life extension from improved fluid cleanliness is disproportionate, meaning that one unit of improved cleanliness translates to multiple units of extended life.
Using a hydraulic piston pump as an example, if the fluid is 10 times cleaner, the pump may last 50 times longer (see the nomograph in Figure 1). The disproportionality works in your favour if the oil is cleaner (5 to 1) but works against you if it’s dirtier (1 to 5). Hydraulic fluid that is twice as dirty reduces service life down to 20% or less. This might occur if a filter bursts or is in bypass mode.
You can use this online calculator to get a better idea of how increased cleanliness might affect machine reliability. It is based on Noria’s well-known life extension table.
For rolling element bearings, I recommend that you consult the charts in Annex A of the ISO 281:2007 standard (Rolling Bearings - Dynamic Load Ratings and Rating Life).
10X Times Drier
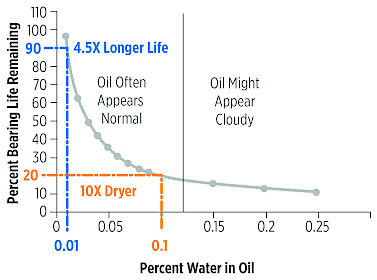
The relationship to water contamination is also rather easy to predict. Similar to the impact of particle contamination, the detrimental effects of water on bearing service life have been shown through ALT testing. This data is explicit and authenticates the relationship between water concentration and life expectancy. An example of one such study is summarized in the graph in Figure 2.
Just like particles, there are many different factors at play, including bearing type, operating temperature, lubricant type (base oil additives), the state of water (dissolved, emulsified, free), etc. The damage caused by water includes corrosion, impaired pressure-viscosity coefficient (poor film strength), hydrogen embrittlement, two-body abrasion and lubricant oxidation.
Like particles, water contamination is disproportionate to service life. For example, by going from 1,000 ppm (0.1%) water to 100 ppm (0.01%), bearing life is roughly 4.5 times longer.
Take a look at the article linked to in Figure B, which discusses nine ways in which water is responsible for damage and failure of rolling element bearings:
20 Degrees Cooler
Determining the relationship between lubricant temperature and bearing life is more complex. The best place to start is to establish the change in viscosity resulting from the change in temperature. Instead of referencing “10 times” with temperature, we’ll say 20 degrees cooler instead. How would reduce an oil's temperature by 20 C impact bearing life?
For bearings, too much viscosity (too cool) is destructive, as is too little viscosity (too hot). Ultimately, we’re trying to optimize the viscosity relative to factors like energy consumption, fatigue life, abrasion (and other forms of mechanical “contact” wear) and general reliability objectives. This can be done by tweaking the ISO viscosity grade, the viscosity index, additives (AW/EP) and operating temperature.
5X Life Extension Example:
-
Let’s say our bearing at operating temperature (40 C) requires an ISO VG 68 R&O oil. This would achieve a Kappa (K) of one. Kappa is the viscosity at operating temperature divided by the required minimum viscosity.
-
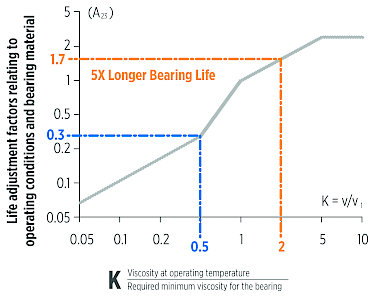
Furthermore, let’s say current conditions normally run at a temperature of 55 C. Using a standard ASTM temperature-viscosity chart for ISO VG 68, the actual viscosity is 34 cSt at that temperature, resulting in K=0.5. The service life factor (A23) is 0.3. See Figure 3.
-
If we reduce the temperature of the lubricant by 20 C (from 55 C to 35 C), the viscosity rises to 135 cSt and K=2 and A23=1.7. This 20-degree temperature reduction, using the chart in Figure 3, increases the bearing life estimate by five times (5X). So, in this example, a 20 C reduction in oil temperature translates to five times longer bearing life.
10X Better Aligned
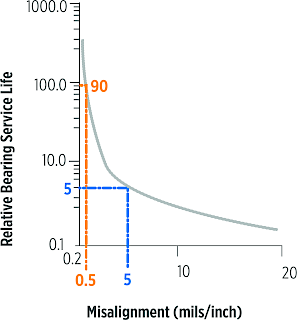
The relationship between shaft alignment and bearing reliability is reasonably well understood. The graph in Figure 4 above does a good job of representing how misalignment can nibble away at bearing service life. Going from 5 mils/inch to 0.5 mils/inch (10 times improvement) can translate to over 10 times longer bearing service life. Of course, like the previous examples, many other factors play a role as well, including load, speed, bearing type, lubricant, etc.
10X More Training
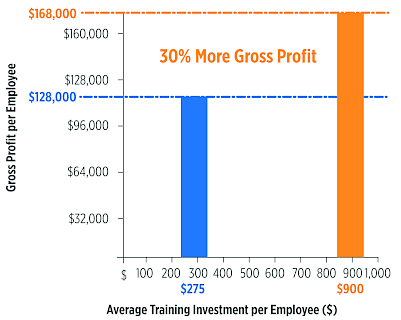
So far, we’ve only been talking about bearings. The chart shown in Figure 5, published by the American Society for Training and Development, shows an interesting relationship between gross profit per employee and training. According to their numbers, an annual investment of $625 per employee yields an annual return of $47,000. Extrapolating from this chart, a 10 times increase in training investment (going from $90 to $900/year) yields roughly $68,000 return per employee.
How does more training of maintenance personnel affect the life of bearings? Here are a few ways: better lubrication, better inspection, better condition monitoring, better fit and clearance, better balance and alignment, less mechanical looseness and better contamination control.
