Introducing Condition Alarm Mapping (CAM)
The sheer number of infographics in the condition monitoring field is staggering; they show up on social media, and in conference presentations, whitepapers, websites and books. Infographics are effective at helping people comprehend difficult concepts that integrate an array of variables and factors.
My soon-to-be-published book, “Inspection 2.0,” covers a host of different condition monitoring methods, including sensory inspections. I was looking for an infographic to illustrate failure modes and detection methods in the time domain for different types of machines and applications but was unable to find a graphic that fit my needs.
Necessity is the mother of invention. Left without choices, I decided to construct my own graphic, naming it Condition Alarm Mapping (CAM). The final product is shown in the figures on the following pages. However, the number of variations and uses of the CAM graphic is extensive and goes far beyond the scope of this article. As an introduction, I can show and describe what it is, why it is needed, and how it is used.
 Deconstructing Condition Monitoring
I set a high bar for myself when developing the CAM. I wasn’t sure it was even possible. I kept trying different sketches and graphical schemes, a few of which were bizarre and far-fetched. I knew it needed an unconventional look but, at the same time, I fought to keep it simple and intuitive.
The following describes what I attempted to encapsulate in my graphic:
Different Machine Types and Applications - In addition to a large number of machine types and applications, there are also different operating factors (speeds, loads, temperature, etc.).
Ranked Failure Modes - The Pareto Principle is a method that has been used to illustrate and rank failure modes. Failure Mode and Effects Analysis (FMEA) and Root Cause Analysis (RCA) methods are also widely applied to better understand failure modes specific to the machine and its application. By ranking them, failure modes are put in the proper order based on the frequency and destructive potential.
Detectable Failure Signals - During failure, different failure signals are transmitted. These can relate to the root cause, the effect (symptom) or both. Root causes could be mechanical looseness, misalignment, lubricant starvation, contamination, etc.; symptoms could be vibration, acoustic, heat, wear debris and operating malfunctions. These are the signals that condition monitoring seeks to detect and interpret.
Time Domain to Failure - A transmitted signal varies in strength (amplitude) in the time domain. The time domain starts at 100% remaining useful life (RUL) and ends at zero (functional failure). Weak signals are harder to detect and discern. Strong signals are often too advanced, being associated with limited RUL of the machine. Early detection is what condition monitoring seeks to achieve, but it is also the most challenging for the condition monitoring analyst to achieve.
Condition Monitoring Detection Methods - The technologies and methods of detection give asset owners numerous options. Optimizing the selection and use of these methods is the name of the game. Knowing how one method measures up to others is difficult for people new to the field. The CAM graphs are particularly useful in that regard.
The table in Figure 1 compares conventional graphic methods (on the left) with target factors or variables (shown in the columns to the right). Only the CAM graphic shows comprehensive visual integration.
| What's included in the Infographic | ||||
|---|---|---|---|---|
| Graphic Form | Ranked Failure Modes | Detectable Failure Signals | Time Domain To Failure | Condition Monitoring Detection Methods |
| P-F Interval | ✖ | ✖ | ✔ | ✖ |
| Remain Useful Life Chart | ✖ | ✖ | ✔ | ✖ |
| Pareto Principle | ✔ | ✖ | ✖ | ✖ |
| Weibull Analysis | ✖ | ✖ | ✔ | ✖ |
| Condition Alarm Mapping (CAM) | ✔ | ✔ | ✔ | ✔ |
Structure of the CAM Graphic
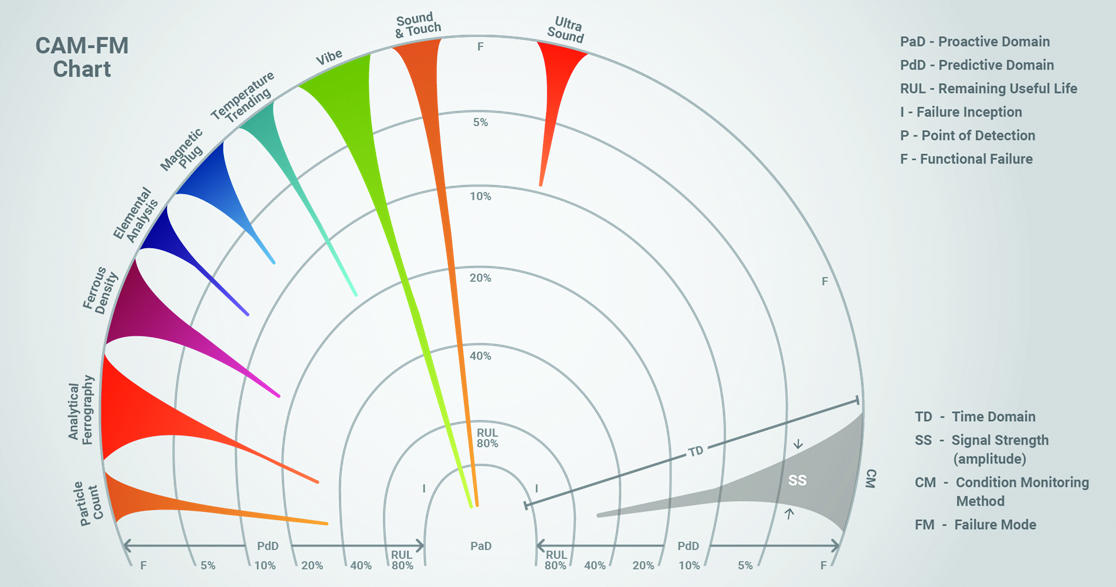
Figure 2 shows the basic structure of the CAM graphic using mechanical looseness as a single failure mode. The graph is basically a semicircle with the central point representing the proactive domain (PaD). This central point represents 100% RUL. Failure inception (I) occurs in the proactive domain. If the problem is not quickly detected and removed, failure will progress in an outward direction to the first ring. Each successive ring in the predictive domain (PdD) after 80% reduces the RUL by 50% until functional failure (F) is reached (the final outward ring).

The coloured spikes refer to condition monitoring methods and the failure signals they can (potentially) detect. Going clockwise from the left side, you can see particle count, analytical ferrography, ferrous density, elemental analysis, etc. The tip of these spikes approximates the point of earliest detection (P) in the time domain. The diameter of the spikes is the signal strength (amplitude) at that point in the time domain. The signal strength becomes greater as failure progresses.
From the CAM graphic, you can get an idea of the condition monitoring methods that are the most promising for early detection. Note that the placement and shape of the spikes can vary as influenced by various factors, including skill, technology, frequency of use, machine type, etc. As such, the CAM graphic can be tweaked to more accurately fit the application.
While this CAM is representing mechanical looseness as the failure mode, other similar CAMs would be constructed for each highly ranked failure mode, such as contaminated oil, wrong oil, misalignment, etc.
Detection-Based CAM Graphic
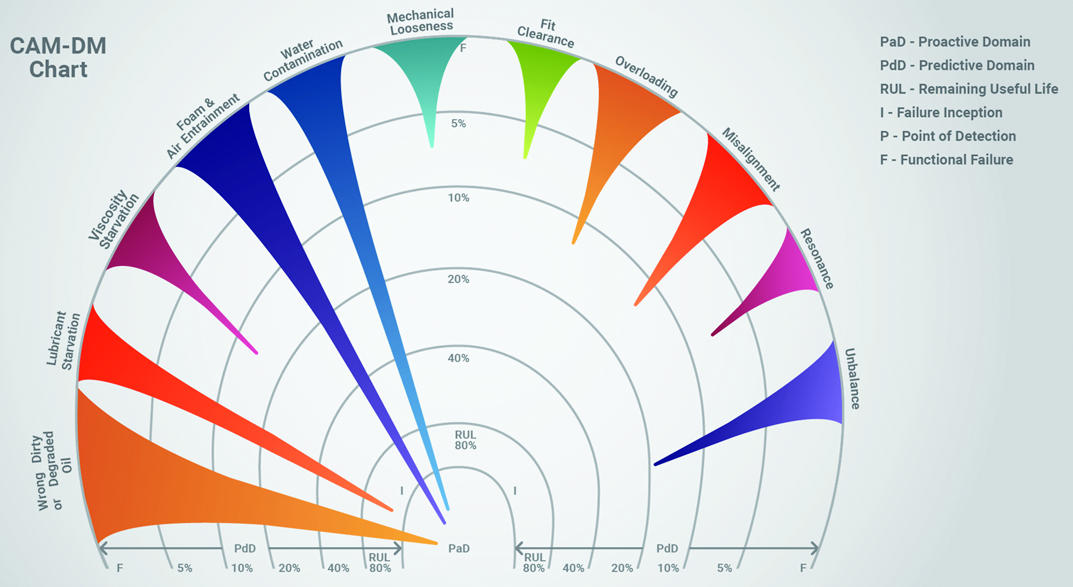
While Figure 2 presents a single failure mode (looseness) against multiple detection methods, Figure 3 presents the chart in inverse form. Specifically, it shows a single detection method (sight glass inspection) against multiple failure modes.

Each spike has the same meaning as previously described. Early detection and effectiveness of detection are characterized by the length and width of the spike. Similar CAM graphs could be constructed for each of the other detection methods being considered, such as vibration, ultrasound, etc.
Pareto-Based CAM Graphic
The Pareto Principle provides a practical ranking of failure modes based on the probability of occurrence and consequences. This ranking comes from experience and RCM methods such as Failure Modes Effects Analysis (FMEA). Root Cause Analysis (RCA) can be extremely helpful too.
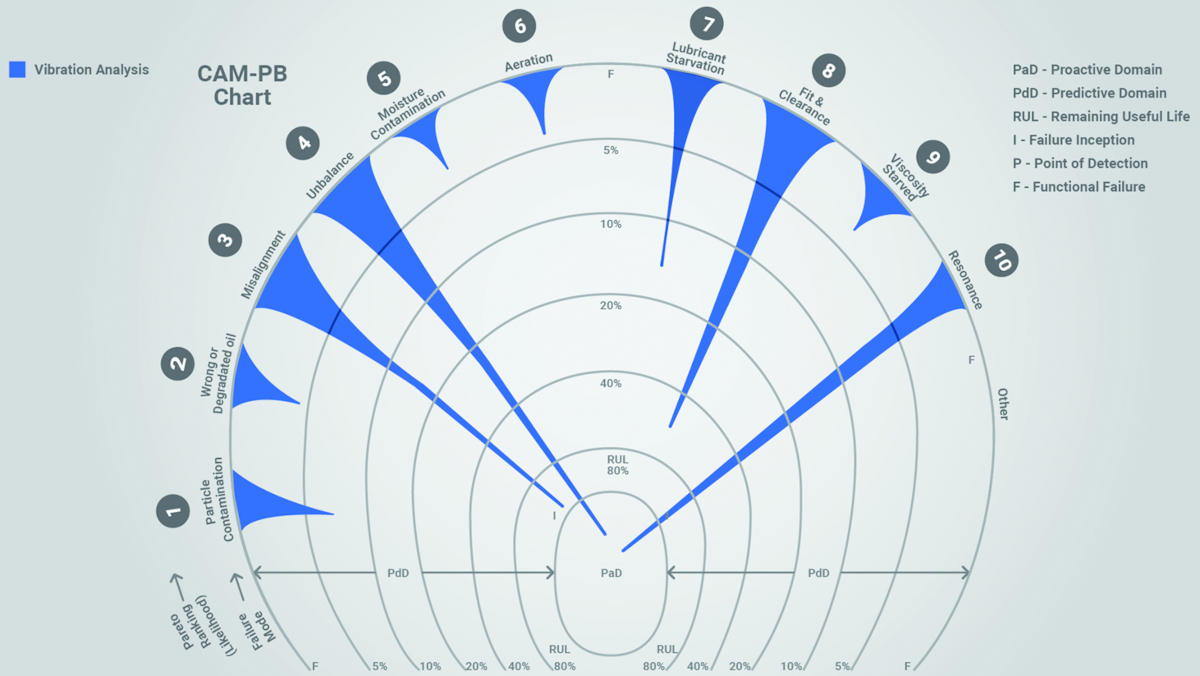
The CAM graphic in Figure 4 shows the failure modes for rolling element bearings in order of their ranking from left to right (clockwise). Again, this can be customized to the application. The single detection method is represented in each chart. The CAM graph shows vibration analysis as an example. As can be quickly seen from the spikes, vibration is really good at some failure modes (misalignment, unbalance, resonance) and far less effective at others (particle contamination, degraded oil, viscosity starvation).

Viewed in this way, it is apparent that a single condition monitoring method (vibration) is inadequate for protecting the bearings of the machine from all the highly ranked failure modes.
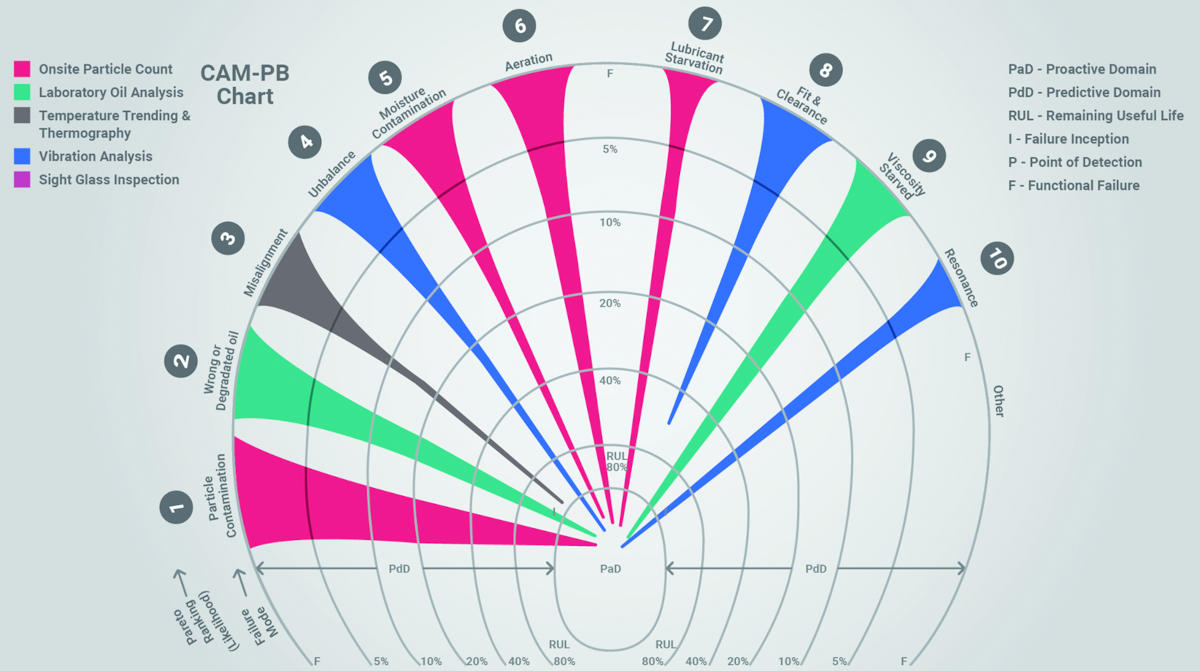
By combining the best detection methods with the Pareto-ranked failure modes, the most comprehensive level of coverage and protection is achieved, as illustrated in the CAM graph in Figure 5. The spikes are colour-coded to represent the different detection methods, as shown in the legend (upper left corner). Unlike Figure 4, each spike reaches down at or near the proactive domain (central region of the CAM graph).

Figure 4 and Figure 5 represent the same machine or component (rolling element bearing). Figure 4 applies only a single detection method (vibration), whereas Figure 5 applies five methods. The final optimized selection of the detection methods and frequency of use can now be easily rationalized to achieve the best results.
In Sum
Condition Alarm Mapping is a graphical representation of condition monitoring across multiple machine types, applications and detection methods. It emphasizes the importance of showing the time domain from failure inception and the ability of the detection methods to deliver good results.
Using this method, the user can better achieve:
- Early fault or problem detection
- Prolonged P-F interval
- Optimized choice or selection of condition monitoring methods (including inspection)
- Prioritization of resources, based on ranked failure modes for individual machines and applications
