The Anatomy of a Filter Inspection Report
When the history of the condition monitoring field is written, there will likely be a chapter, or at least a few pages, on the odd paradox surrounding how infrequently use of used filter testing was employed (in the beginning). The assumption is that filter testing will eventually enjoy widespread use as misconceptions and ignorance of its benefits fade away. As I write today, the vast majority of people engaged in condition monitoring are oblivious to the wealth of information found in used filters.
The target application relates primarily to critical equipment, i.e., those that are expensive to repair or have high downtime costs. A well-engineered condition monitoring program should align the data being gathered with the failure modes we seek to detect. Granted, these are failure modes of highest risk to the machine, based probably on the occurrence and consequences (business interruption, etc.).
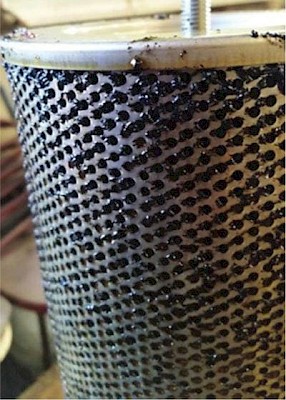
Think of the logic behind this. Filters are intended to purify by removing solid contaminants that are harmful to the oil and the machine. If the filter is doing a good job, it is removing contaminants as fast as they are entering (ingression). This is known as mass balance. The number of particles coming into the oil system (particle ingression) equals the number being caught by the filter (particle removal); this achieves a stabilized and controlled oil cleanliness level. While particle removal is advantageous to the oil and the machine, it gets very low marks when the oil being cleaned is sampled for analysis.
The reasons for doing oil analysis fall into three categories: fluid properties analysis, fluid contamination analysis and fluid wear debris analysis. Filtration can have a marked, negative impact on contamination and wear debris analysis, two of the three categories.
Wouldn’t you agree that it is valuable to know about dirt and other abrasive contaminants? It is the leading cause of failure for many machine components, especially bearings. One could argue it's even more important to know the amount and characterization of wear debris generated by your machine.
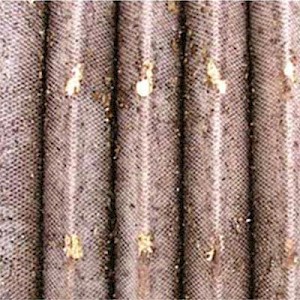
We need to stop lying to ourselves. In many cases, the oil is not the best place to get answers to those questions. The answers (particles) were briefly in the oil for sure, but they were quickly removed and now reside in the interstices of the filter.
Over time, your filter becomes loaded with data, like a hard drive. But sadly, the filter is usually discarded, along with the data it's carrying. In contrast, a filter that’s skillfully inspected and analyzed tells a story about the history of the machine and the oil. Yes, it is often more expensive than oil analysis by itself. However, you can’t analyze what isn't there. Go to where the data resides, not to where it used to be. Don’t be a penny wise and a pound foolish.
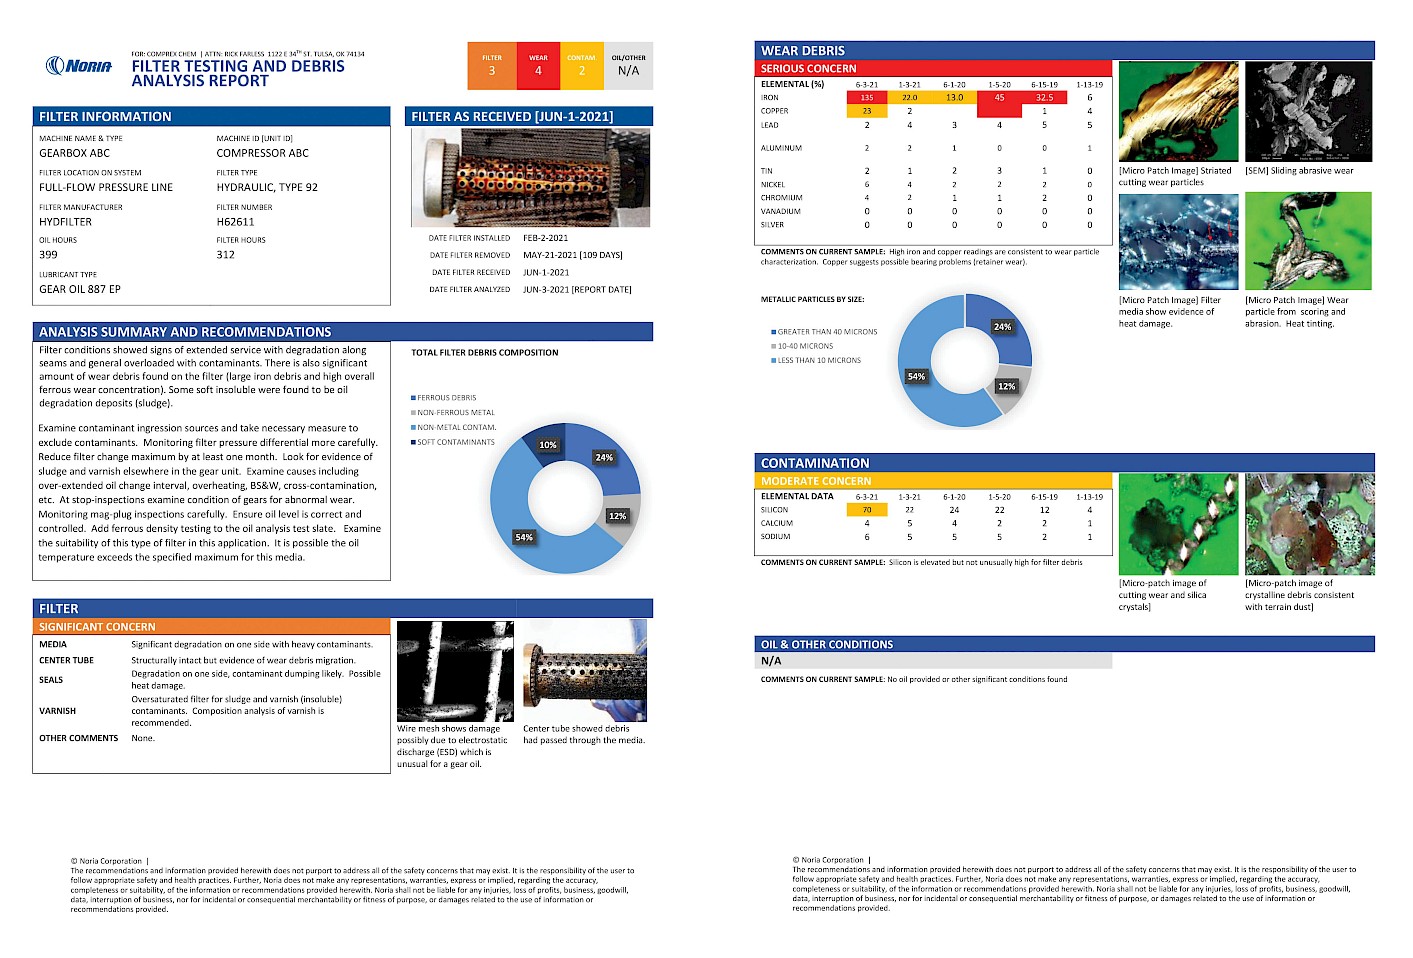
Many of the major labs that provide oil analysis services also provide used filter analysis. Noria offers used filter testing as well. The report shown in figure 5 is an example of data that can be extracted from a filter as received by the lab for inspection and analysis.
Visual Inspection of the Filter
Make sure you’re using a lab familiar with how to examine a used filter. There are many subtleties requiring special knowledge and skills. These relate to the filter media, the centre tube (core), the seals, varnish (end caps and centre tube), and adhesives. The complete filter needs to be examined, with findings included in the comments section of the report.
Next, the filter should be dissected. The media pack will need to be cut away (or sheared) to allow the pleats to be spread open like an accordion. The condition of the pleat pack should be closely examined for structural and manufacturing integrity. Look for holes, breaks and sludge.
The individual plies of the pleat pack can then be peeled away to allow the actual filter media to be examined (usually the centre ply). Some filters have as many as six different plies. Many labs use light tables to look across the filter media for inconsistencies.
A system should be used to characterize or grade the visual observations of the filter and media. For the filter in the through “significant concerns” were noted. A description of the nature of these concerns is provided in the table. The better labs will include annotated photos of the filter and media in the report.
Wear Debris and Contamination
Removing contamination is the primary function of the filter. Look for evidence that the filter is doing this job and the integrity of the media has not been compromised (cracks, ruptures, etc.).
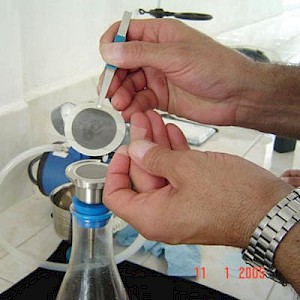
Particles can easily be removed from the filter media for both soft and hard analysis. One method is the particle resuspension method using an ultrasonic bath. Other labs backflush the filter or swatch of media to extract the particles for examination. Either method is suitable.
The particles can then be examined visually, similar to analytical ferrography. This can best be done by preparing a micropatch or ferrogram (or both). Contaminant and wear debris characterization can follow the methodology described in ASTM D7684.
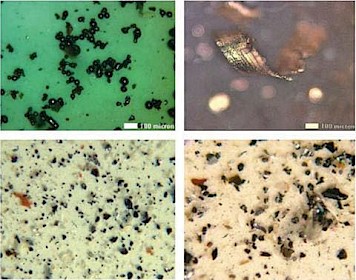
Photomicrographs of salient (meaningful) particles should always be included in the report. Ideally, these images are annotated or have a caption with descriptive information. Scanning electron microscopy (SEM) images are often provided by labs as well.
Elemental analysis is important to better understand the composition of the particles. Examples of elemental data of particles extracted from a filter are seen on page two of the example report (Figure 5). The relative concentrations of metals help provide context about the type of particles and their origin. The data can be compared to previous filters to alert to changing conditions.
Different methods can be used to analyze particles elementally. These include Inductively Coupled Plasma (ICP), acid digestion and x-ray fluorescence spectroscopy (XRF). SEM-ESD is another option.
Varnish & Sludge
Many filters will be loaded with soft contaminants. Various methods can be used to better understand the origin/formation mechanism of varnish insolubles, including FTIR and solvent extraction. Colourimetry is also very useful. If soft contaminants are found, their characterization should be included in the report as well.
The number of companies adding used filter analysis to their condition monitoring programs has greatly increased over the past ten years. Particles have a story to tell. But to get the full story, go to where the particles are, not just to where they used to be.
