Oil Analysis Pitfall!

For better or worse, our world is very connected. Some of these connections allow us to communicate freely, while other parts allow us to gather a whole lot of information. I know that I am not the first person to use the phrase “analysis paralysis,” but it really is relevant, especially when it comes to machine reliability. Don’t get me wrong; analysis is extremely important, but focusing on a single aspect of a report or one specific technology can quickly turn into an issue itself.
 I recently had the opportunity to teach an Oil Analysis II class, which included case studies on failure investigations that we have seen or been a part of. Many of these were pretty unique situations and are meant to test how much information the students are able to use and if they could put the new knowledge into practice. Since this was a remote course, not all students were completely active in the exercise, but the ones that were did a very nice job, and it was obvious that they were honing their skills.
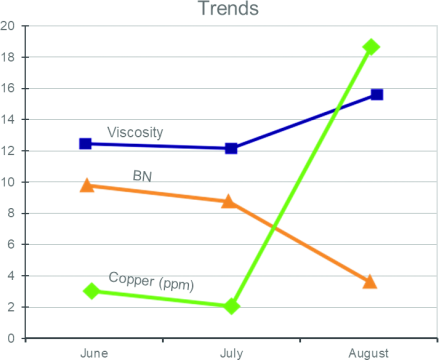
| NEW OIL | USED JUNE | USED JULY | USED AUG | |
|---|---|---|---|---|
| Viscosity (100°C)12 | 11.8 | 11.5 | 16 | |
| BN | 11 | 9 | 8 | 3 |
| Sodium | N/A | 0 | 0 | 60 |
| Boron | N/A | 0 | 0 | 15 |
| Potassium | N/A | 0 | 0 | 20 |
| Copper | N/A | 3 | 2 | 19 |
| Lead | N/A | 5 | 4 | 9 |
| Water | N/A | Neg. | Neg. | Neg. |
| Blotter | N/A | - | - | Pasty center |
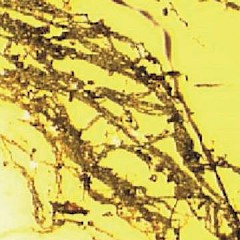
 There was one case study exercise in particular (involving a CAT wheel loader) that I found interesting. There were some oil analysis values given, along with some pictures from the failure investigation.
Now, anyone that has been through the OA II course or has a good foundation in oil analysis might catch what is going on here, but the folks dealing with the machine had no formal oil analysis training.
The thing that folks noticed most frequently was the cavitation on the piston. And yes, that was part of what was wrong, but when we are looking for the root cause of failure, cavitation isn’t the answer. This exercise was meant to show people that you can’t just focus on one part of the puzzle and get to the solution. They were still in the detection phase of things and called the problem solved when they saw cavitation.
 With no water in the samples, I was a bit curious as to what they thought was causing the cavitation or how it was caused inside the cylinder. Air could be the culprit, but this was not likely, in my opinion. I asked them to look a bit more at the oil analysis and determine what had changed. Base number was the first thing that they went to. It isn’t inaccurate to say that the base number changed, but still, what was the cause of all of this?
Diving more into the oil analysis part of the exercise, we see an increase in three key elements that showed up out of nowhere: boron, sodium and potassium - a few of the key building blocks for many coolants. We had gone over coolants and these building blocks about an hour before, and nobody caught this. They were too focused on the image of the piston and trying to figure out what the filtergram patch was telling them.
