Soluble and Insoluble Varnish Test Methods for Trending Varnish Buildup in Mineral Turbine Oil
Varnish problems in the turbine oil of power plants in Thailand are still an issue today. The problems are the coefficient of oil friction, and will increase along with the increase in varnish concentration and varnish deposits. This creates problems in starting/re-starting the turbine. Even with the advent of oil manufacturing research to improve base oil quality and antioxidant additives, problems started by varnish contamination have been one of the most concerning issues for maintenance. The most recent version of ASTM D4378-20 suggests that maintenance personnel should test their in-service turbine oil and monitor the membrane patch colorimetry with a warning limit at ∆E 30. This monitoring test is known as ASTM D7843-20 Standard Test Method for Measurement of Lubricant Generated Insoluble Color Bodies in In-Service Turbine Oils using Membrane Patch Colorimetry (MPC). This study introduces the monitoring of soluble color bodies and insoluble ones at the same time. Focusing only on the value of insoluble-MPC test can sometimes be misleading and may cause inaccurate and ineffective maintenance decisions. For this paper, three power plants were monitored for both soluble and insoluble varnish, and both soluble and insoluble color body analytical results from in-service gas turbine oils will be presented. It will show how the use of a combination of soluble and insoluble color body assessments of the turbine oils would further improve the oil diagnostic services of turbine lubricants by providing insights into the capability of the lubricants to solubilize the oxidation by-products of the antioxidants and the highly refined base oil. Appropriate varnish removal technologies were also selected and applied to respond proactively to the varnish issues.
 Introduction
Power plants, especially turbines, are expected to operate with high reliability and with controllable operating and maintenance costs. Turbines harness various types of kinetic energy generated by fluids such as water, steam and combustion gases, turning them into electrical energy. The most popular ones are the gas and steam turbines, which can be used individually or combined. The unexpected upsets in power generation are the undesirable occurrences that take place in power plants. Notwithstanding the obvious loss of electrical generating revenue, there may also be a penalty to the power plant for unexpected trips.
Because of this, choosing, using, and monitoring the right lube oil for the turbines is very critical. Turbine oils are needed to provide protection and contamination control for the turbine. However, the changes in gas turbine designs over the last decade, coupled with the changes in turbine oil formulations, have led to a real and identifiable problem of oil-related turbine trips that are caused by an oxidation by-product of oils called varnish [1]. The oxidation of the oil is a spontaneous process that, over time, may result in the production of these varnish products. Lubricant varnish generally is defined as a thin, soft, lustrous, oil-insoluble deposit composed primarily of organic residue [2]. These deposits are caused by thermal degradation, oxidation and/or contamination. They have limited solubility in the base oil. They can cause filter plugging and excessive wear on parts and could lead to the failure of bearings or other critical components, such as servomechanisms (seizing) [3]. This varnish also results in a high coefficient of friction and restricts the movement of the turbine. Because of this, different Original Equipment Manufacturers (OEMs), such as Solar Turbines [3], Siemens [4], General Electric [5] and Mitsubishi [6], recommend routine sampling and testing of lubricating oil quality (a more proactive approach to prevent serious problems), including monitoring oil’s varnish formation potentials because varnish formation is a common issue to be monitored for in turbines, whatever the OEM is. The standard used for the monitoring of turbine oils is the ASTM D4378-20, Standard Practice for In-Service Monitoring of Mineral Turbine Oils for Steam, Gas, and Combined Cycle Turbines. Varnish formation is monitored by collecting the insoluble colored bodies and measuring their color difference in reference to the International Commission on Illumination (CIE) L*a*b color scale (more on this in section 2.2 Determination of Insoluble Varnish). The difference between two colors in the L*a*b* scale is defined as ΔE. According to ASTM D4378, the ΔE of the turbine oils must not exceed 30. However, the monitoring of insoluble colored bodies alone is not enough and might have blind spots regarding the oil and turbine health monitoring. This study aims to introduce the synergistic monitoring of soluble and insoluble varnish because soluble varnish is the first stage of insoluble varnish, and they must both be detected as early as possible.
In this study, in-service gas turbine oils from three different power plants were sampled and analyzed, including both insoluble and soluble varnish. The results presented here indicate that the monitoring of insoluble varnish together with soluble varnish improves the diagnostic and early correction of varnish problems in gas turbines.
2. Methodology
2.1 Outline
The in-service turbine oil samples were taken from three different power plants to analyze using methods based on the American Society for Testing and Materials (ASTM) standard and the modified method for soluble and insoluble membrane patch colorimetry (MPC). These three natural gas power plants have turbines generally operating with gas turbine speeds of about 5,250-6,600 rpm, exhaust temperatures of about 560-597 C (1040-1106 F), and output power of 50-70 MW. The major inspections and maintenance are done every six years or 48,000 hours.
2.2 Determination of Insoluble Varnish
The method ASTM D7843-20 [7] is known as insoluble MPC. Oil samples were mixed with petroleum ether and filtered through a membrane patch. The color of the patch caused by captured colored insoluble bodies was measured colorimetrically in the CIE L*a*b* color scale using a spectrophotometer. The L*a*b* is a three-dimensional color space that covers the entire spectrum of colors perceivable by human vision. The a* is positive towards the red direction and negative towards the green direction; b* is positive towards yellow and negative towards the blue direction. L* is positive towards the lightness direction and negative in the darkness direction. This color space system is produced by plotting the rectangular coordinates L*, a* and b*, which are defined by equations 1-4:
The tristimulus values of Xn, Yn and Zn define the color of the normally white object as a reference point (which, in this method, is the unused membrane patch), while the tristimulus values of X, Y and Z define the resulting color of the membrane patch after collecting the colored bodies brought by the insoluble varnish from the used oil sample. After the filtration and collection of colored bodies, the CIE L*a*b* color space was used to quantify small differences in color. The results were given as ΔE by equation 5:
2.3 Determination of Soluble Varnish
The modified method ASTM D7843-20 is known as the soluble MPC. This method uses the same patch and color measurement as the insoluble MPC method. The two methods differ in sample preparation, as the soluble MPC proceeds without dissolving the oil samples in a solvent. Samples were blotted directly onto a membrane patch without filtration. Because of this, all the colored bodies, both insoluble and soluble, were collected on the membrane patch. Colored oxidation by-products were deposited and separated on the membrane patch through capillary action. The color of the patch caused by captured colored bodies was also measured colorimetrically in the CIE L*a*b* color scale using a spectrophotometer, and the results were given as ΔE.
 2.4 Additional Test Methods for Oil Condition Monitoring
2.4.1 Determination of Viscosity
Kinematic viscosities at 40 C (104 F) were measured using a viscosity bath apparatus and viscometers. The time for the oil to reach the starting point and end point in the viscometers was measured and multiplied by the viscometer constant to calculate the viscosity. The method conforms to ASTM D445 [8].
2.4.2 Fourier Transform Infrared Spectrometer
Analytical spectra of the oil samples were taken using a Fourier Transform Infrared Spectrometer (FTIR) instrument to monitor the oxidation effects. The sample cell was a potassium bromide (KBr) cell with a pathlength of 0.05 mm. The oxidation area of measurement was at 1800-1660 cm-1. The method conforms to ASTM D7414 [9].
2.4.3 Voltammetry
The relationship of oxidation, varnish formation and additive depletion was tested using a commercially available voltammeter and the remaining useful life evaluation routine (RULER) technology. Neutral electrolytic test solutions were used to monitor both aromatic amines and phenolic antioxidants. RULER’s software calculates the remaining useful life (RUL %) of the oil per additive type. The method conforms to ASTM D6971-14 [10].
2.4.4 Determination of Total Acid Number
As the oil oxidizes, it produces acidic by-products and becomes acidic in nature. Therefore, the monitoring of the total acid number is a handy tool for monitoring the age and usefulness of the oil. The oil was dissolved in a suitable solvent and was titrated against a basic titrant: potassium hydroxide solution. Total acid number was measured by recording the amount of potassium hydroxide needed to neutralize the acid present per one gram of the oil sample (mg-KOH/g sample). Total acid numbers were performed using ASTM D974 [11].
2.4.5 Rotating Pressure Vessel Oxidation Test
This test method is to determine the oxidation stability of the oil. The tests were performed using a rotating pressure vessel oxidation test (RPVOT) instrument, subjecting the oil to a stressful environment consisting of water, a copper catalyst, and high-pressure with oxygen. The antioxidants present in the oil samples resisted the oxidation brought by the extreme testing condition until all of them were consumed. This was reported in remaining percentage of oxidation stability. The method conforms to ASTM D2272 [12].
2.4.6 Particle Count
This test was done to determine the oil cleanliness using a laser particle counter. The cleanliness levels were represented by the classification system ISO 4406 standard [13], which reported the number of particles in >4 µm size, >6 µm size, and >14 µm size per 1 mL of oil.
3. Results and Discussion
3.1 Case Study #1

3.1.1 General
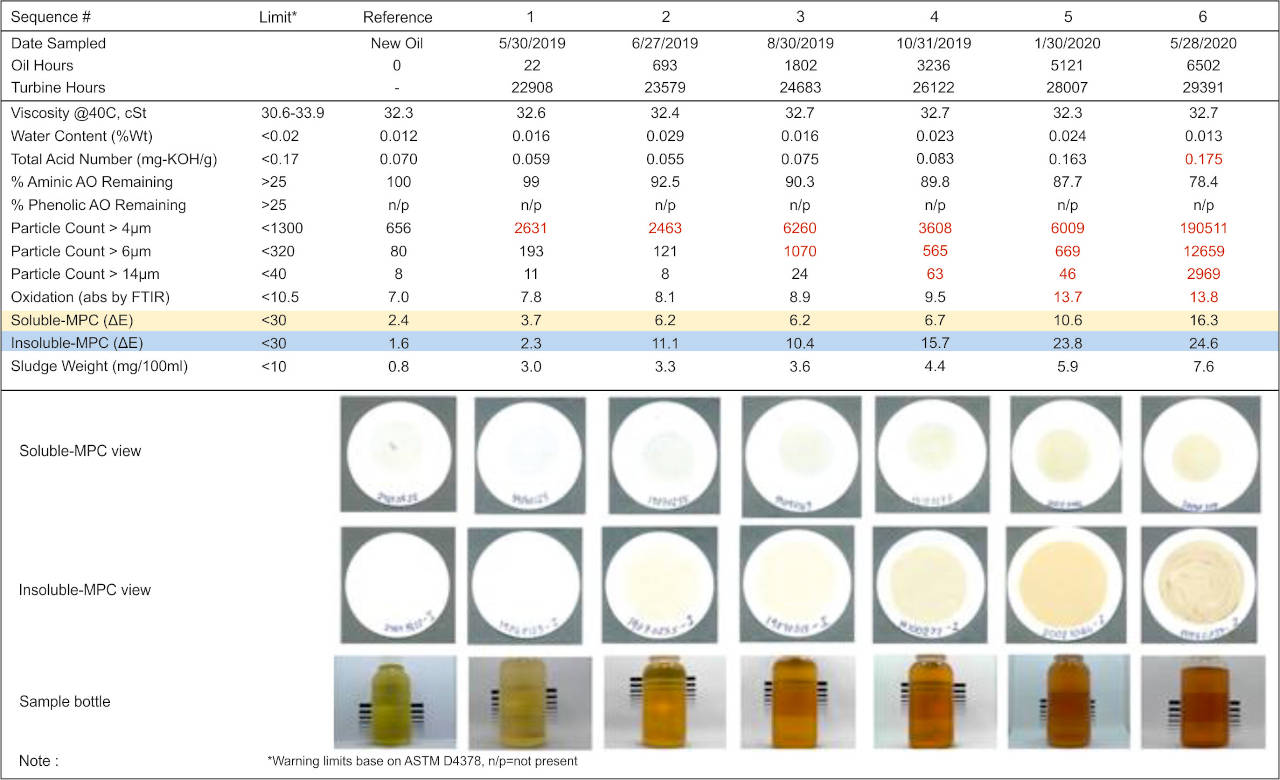
Plant #1’s oil samples were taken for analysis every two months for a period of two years. Table 1 shows the summary of its oil analysis results. During outage, all accessible parts were inspected, particularly the reservoir, main journal bearing, and regulating valves. Varnish deposits were found on the bearing pad, as shown in Figure 1.
3.1.2 Monitoring Oxidative Health of Turbine Lubricants
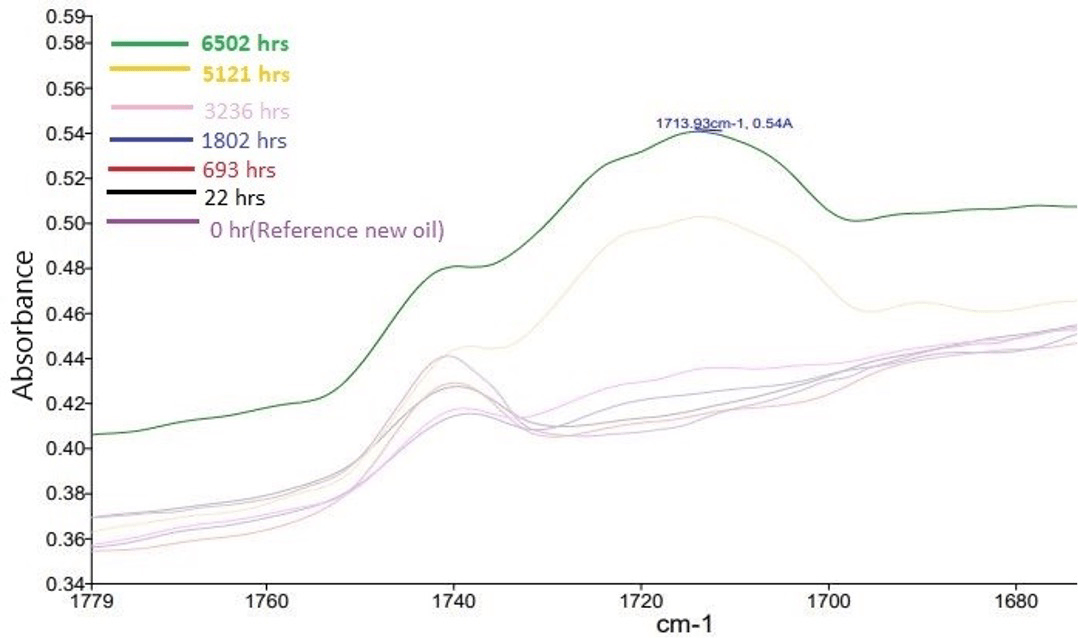
Upon analyzing other oil analysis parameters, there is a positive indication that these varnish deposits were due to oil degradation. Increasing oxidation levels were observed using FTIR analysis. Degraded oil had an increasing FTIR oxidation at 1713 cm-1, as seen in Figure 2.
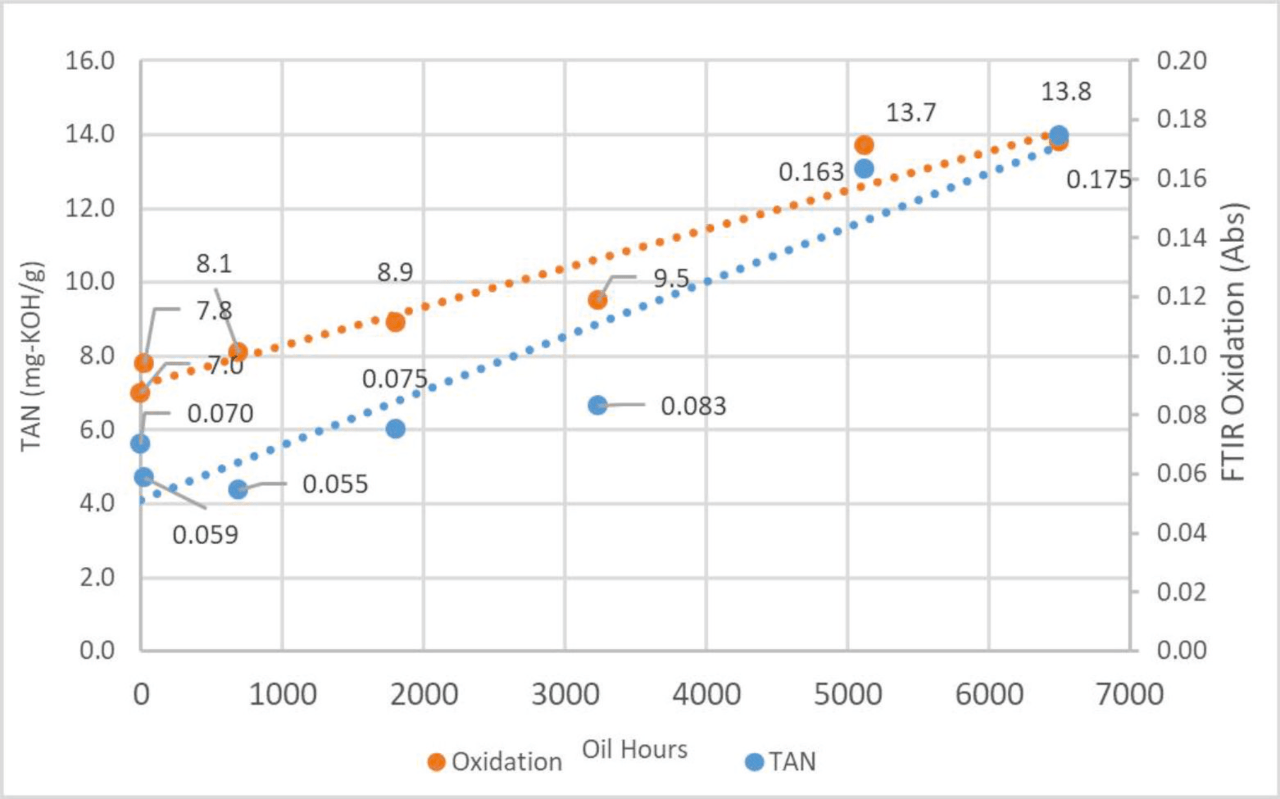
During the oxidation process, hydrocarbon molecules of base oil will break down, and reaction products will be formed, including acidic by-products, varnish and sludge. The increasing trends of both oxidation and acidic by-products of oxidation are shown in Figure 3. As oxidation levels increase, the total acidic products present in the oil also increase. The increased number of these acidic products may escalate the production of other oxidation by-products, such as varnish and sludge. The graph below shows that FTIR oxidation and total acid number both increase with the oil hours.
Due to the spontaneous course of oxidation, radicals, which are very reactive, might also be formed. Subsequent reactions of these radicals lead to the formation of peroxides. These by-products must be quenched by the antioxidants in order to preserve the lubricant integrity or its RUL. If the RUL of the oil reaches its critical state, the formation of acids, resins, and other undesired chemical compounds is inevitable; these are seen as final reaction compounds and mean that it is too late to react with the turbine’s maintenance or repair program.
3.1.3 Deposit on Bearing Pad Related to Sludge on Insoluble-MPC Patch
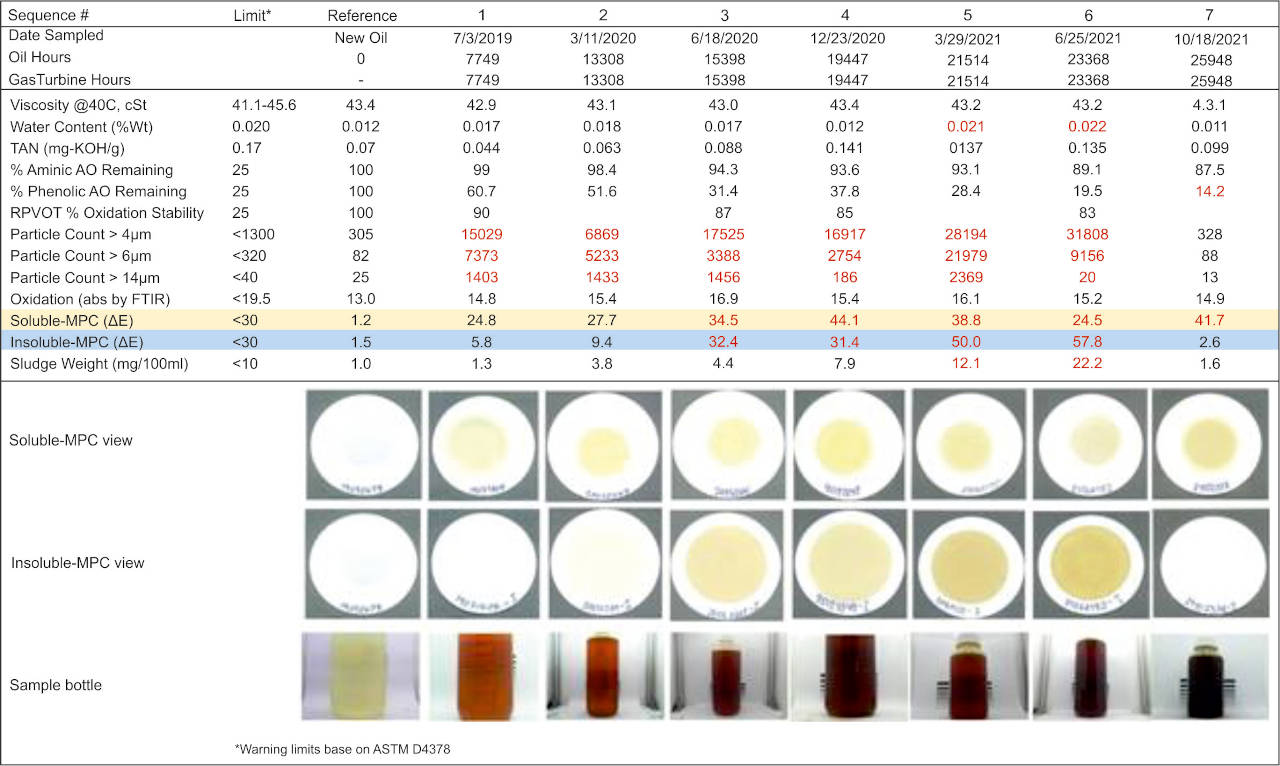
Figure 4 summarizes the trend for both insoluble and soluble MPC. It is shown that soluble-MPC and insoluble-MPC increase with oil hours. The varnish life cycle can be explained [14]: As soluble varnish builds up, the lubricant’s saturation is eventually reached. At this point, any additional varnish produced will be insoluble since the capacity of the lubricant to hold varnish has been exceeded. Therefore, continued degradation of an already saturated lubricant produces insoluble varnish particles, which can eventually agglomerate to produce deposits. In this case, both soluble and insoluble should still be lower than ∆E 30. Particle count is an early indicator of when the soluble varnish starts to become insoluble varnish. It shows that insoluble-MPC was responsible for the deposition of the bearing. The appearance of deposits on the bearing during power plant outage was observed, and it was confirmed that sludge formation on insoluble-MPC affects the deposit on the bearing pad, as shown in Figure 1. Monitoring the insoluble-MPC shows us if the varnish is already sticking out of the surfaces, while monitoring the soluble MPC gives us information on the saturation level of varnish in the oil, which could further lead to more sludge sticking onto surfaces. It is proactive to do so, so the early removal of the soluble varnish by varnish removal technologies (VRT) before transforming to the insoluble phase can increase the longevity of the oil life by keeping the oil in a soluble condition. Table 1 summarizes all the data for the oil analysis of Plant #1’s turbine oil. Both the soluble (modified method, highlighted in yellow) and insoluble varnish (standard method, highlighted in blue) were tested for the oil samples.
Upon checking the summary of the oil analysis results from Table 1, the critical levels of ΔE 30 for turbine oils based on ASTM D4378-20 [15] are not applicable at all times to all oil types and equipment combinations. In this plant, their turbine already accumulated varnish problems even with their ΔE 24.6 — lower than the standard value of 30. This means that published OEM and ASTM limits are for general practices only. Trending and monitoring of oil analysis results, including the soluble and insoluble varnish potentials, alongside physical examination of the equipment, are much better — the warning limits can be set specifically for each oil and equipment combination. Furthermore, the mechanical inspection reveals that a better alarm limit would be lower than ΔE 24.6.
Monitoring the oil analysis results of the turbines, including both insoluble and soluble MPC for varnish monitoring, can help extend the life of the oil and overhauling schedules. Generally, most OEMs recommend major overhauls to be done after 48,000 operation hours. But for this case, it can be seen that varnish and sludge had already formed at around 28,000 operation hours. Predicting and extending the life of the oil differs from one equipment and oil combination to another. First, the trend is established and monitored. Second, the root cause is examined, and appropriate action to address the problem is taken. In this case, since both the soluble and insoluble MPC were tested, varnish issues should be addressed. Afterward, the unit will be monitored via oil analysis, personalizing the predictability and extension of the oil’s life span depending on analysis such as the RPVOT, oxidation level indicators, wear condition, and contamination condition.
Note: Equipment type (Gas Separation Plant), Lube Oil capacity (4,600 L), Oil type (R&O Inhibited ISO 32), Antioxidant (Amine type).
3.2 Case Study #2
3.2.1 General
Plant #2’s gas turbine oil routine samples were used to monitor quality and varnish buildup. Table 2 shows the summary of its oil analysis results.

3.2.2 Additive Depletion Related to Varnish Buildup
Varnish buildup is not only caused by oxidation but is also due to additive depletion. Figure 5 shows the decrease of % remaining aminic and phenolic antioxidant additives while both soluble and insoluble MPCs increase. The results also showed that the phenolic antioxidant depletes more rapidly than the aminic antioxidant. This phenomenon is known as premature phenolic depletion. The rapid phenolic depletion is also explained by the phenolic acting to preserve or protect the amine antioxidant, combined with the oxidation resistance of turbine oil [16].
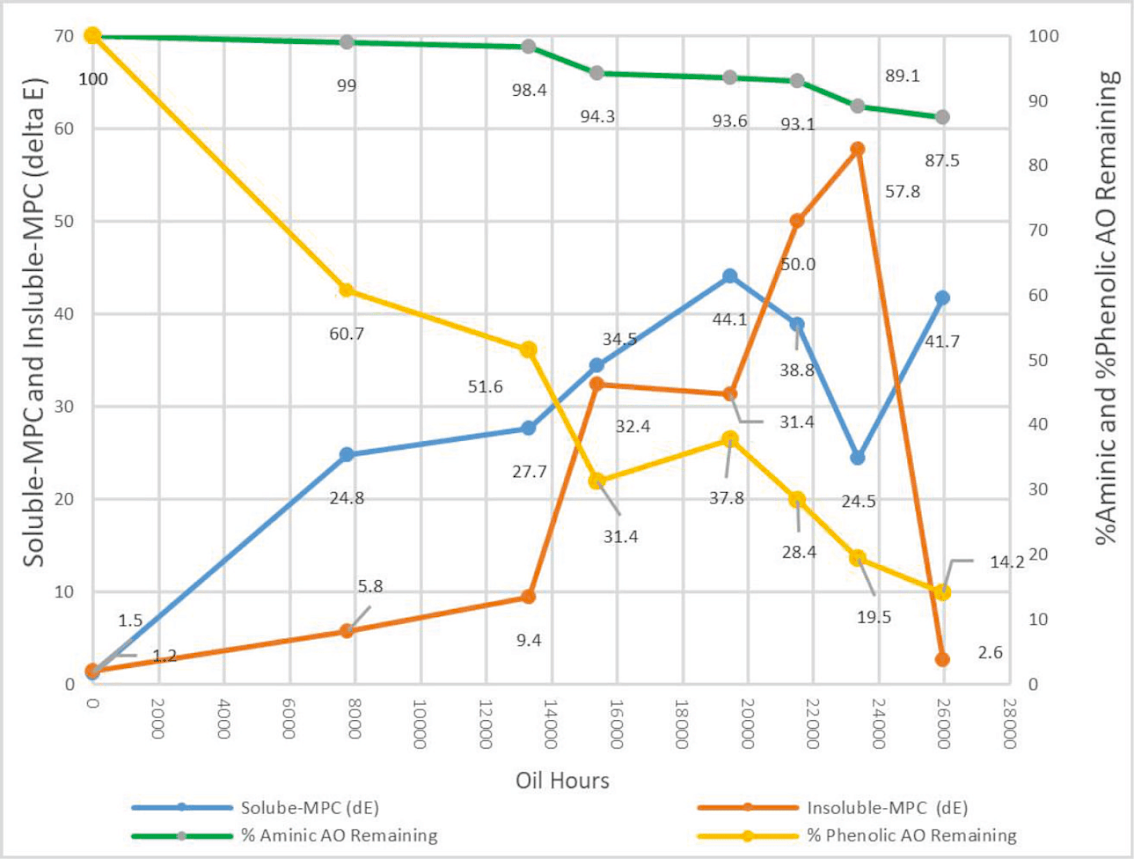
As indicated in Table 2, RPVOT has not yet declined to 50%; however, the oil begins to form sludge. A problem related to the varnish issue is the phenomenon of additive depletion. Aminic type additives are used as an antioxidant, and phenolic types are usually used for demulsifiers and varnish control. Both aminic and phenolic type additive depletion was monitored using linear sweep voltammetric analysis to quantify the remaining concentration of antioxidants by comparing the voltammetric response of the new oil against the used oil.
The earliest sign of oil degradation is detected with linear sweep voltammetry since the antioxidants are the most reactive species in the turbine oils, and they are the first to be depleted.
Note: Equipment type (Combined cycle gas turbine), Capacity (126 MW), Lube oil capacity (12,000 L), Oil type (R&O Inhibited ISO 46), Antioxidant (Aminic and Phenolic type).
3.2.3 Particle Count Related to Insoluble-MPC
Laser particle counter results are in accordance with ISO 4406, which counts suspended particles in oil. In this standard, particles larger than 4 µm, 6 µm and 14 µm are examined and counted. As seen in Table 2, there is a correlation between particle size greater than 4 µm and insoluble-MPC. Moreover, it is observed that the sludge weight also increases with insoluble-MPC. In this case, when the MPC reached ∆E 30, the power plant decided to use a VRT, a depth media filter, to clean the oil system. Depth media filters are stacked disc filters that can filter out suspended soft contaminants. After depth media filtration, the insoluble-MPC and particle count data improved. If tested only for insoluble MPC, the results might give the impression that the problem was already solved because the insoluble-MPC and particle count levels improved. However, as seen in Table 2, the values for soluble MPC are still above the warning limits of ΔE 30. This means that the oil is still saturated with varnish up to its saturation point, and sooner or later, insoluble varnish will stick onto the surfaces again. The application of the current VRT alone is not addressing the root cause of the problem. A depth media filtration system can remove the insoluble sludge, but the problem of soluble varnish cannot be addressed. Through monitoring of the soluble sludge, a more suitable VRT can be applied to address the problem and prevent the enhanced rate of insoluble varnish formation. Electrostatic filters are other options under VRTs that can also address the soluble varnish. Deciding the appropriate VRT to use to address varnish problems will be made easier if both soluble and insoluble MPC are monitored. If the varnish present is in an insoluble state, depth media filters can be used. If the varnish present is in a soluble state and is already problematic because it is near the saturation point of the oil, electrostatic filters can be used. Electrostatic filters use electrostatic precipitation and balance charge agglomeration concepts to catch even the charged soluble varnish. Ion exchange resin technology is also a type of VRT that can remove organic soft contaminants.
Also, according to Table 2, the phenolic antioxidant levels for this sample already dropped to critical levels. The dropping additive levels should also be addressed to decrease the saturation level of the oil. This is an example of how soluble-MPC can show the varnish-holding capacity of the oil and, conversely, if the oil has reached the varnish saturation point.
Note: Equipment type Small Power Producers (SPPs) Power Plant, Capacity (113 MW), Lube oil capacity (20,000 L), Oil type (R&O Inhibited ISO 32), Antioxidant (Aminic type).
3.3 Case Study # 3
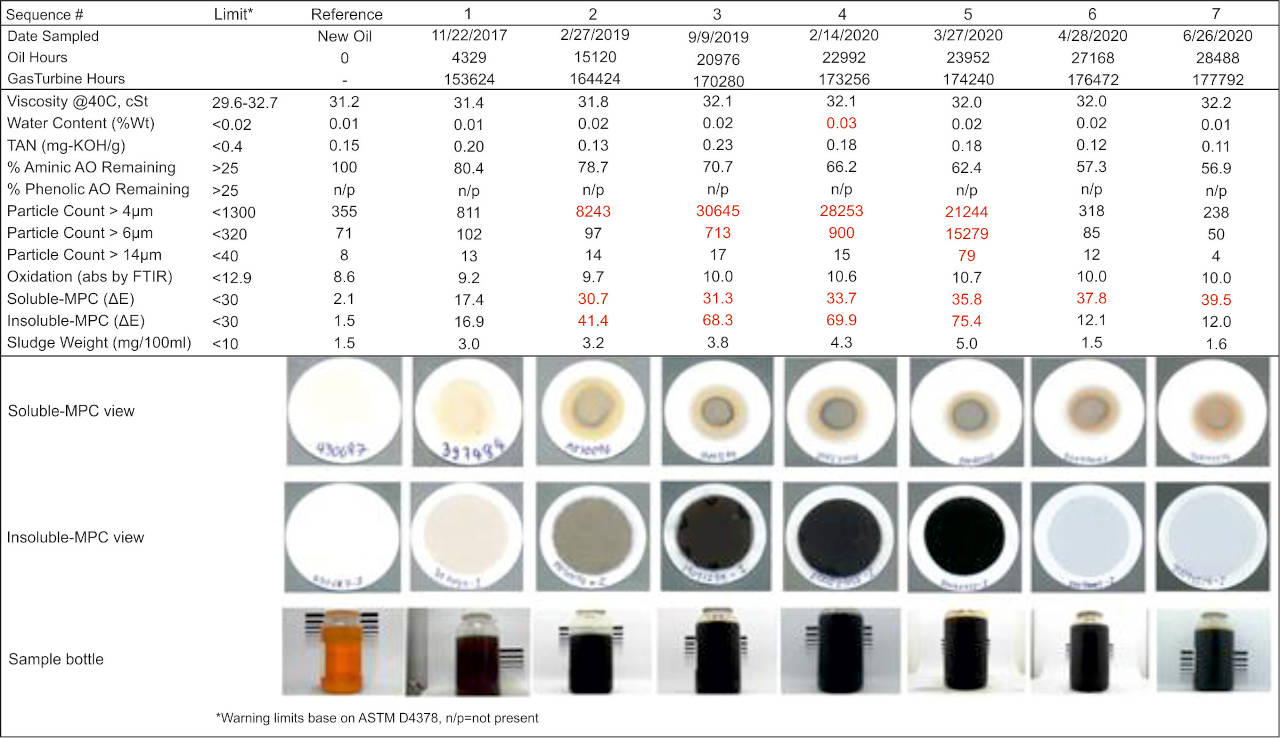
Plant #3 oil analysis results are summarized in Table 3. Gas turbine oil of small power producers (SPPs) power plant was monitored. There is an overheating problem with this turbine system. The base oil degrades through thermal degradation. Coking can occur and can produce insoluble black suspended particles that are carbonized products caused by thermal degradation; this is not necessarily varnish. However, since these carbonized products are also insoluble in oil and are also colored bodies, they become interferences on insoluble MPC results. Instead of a brown patch, a black patch was observed on the insoluble MPC results, as seen in Table 3.
Note: Equipment type Small Power Producers (SPPs) Power Plant, Capacity(113 MW), Lube oil capacity
(20,000 L), Oil type (R&O Inhibited ISO 32),Antioxidant (Aminic type).
According to ASTM D7843, MPC color of the patch residue is measured colorimetrically in the international CIE L*a*b* color scale and darkness with color analyzer. The black insoluble particle directly affects the insoluble-MPC. The dark color of these particles interferes with the color analyzer in CIE L*a*b* color scale. In this example, a color measurement reading of CIE L*a*b* ∆L would have yielded more trendable results than the ∆E measurement since ∆L is the black-white axis and ∆E are color axes. Thereby the insoluble-MPC shows a very high reading which is not varnish. Some of the black suspended particles are carbonized products caused by thermal degradation; these aren’t varnish. The trending for varnish formation using only the insoluble MPC method might be misleading and can lead to inaccurate and ineffective decisions [17].
On the other hand, the soluble MPC method can directly differentiate the varnish (brown stain) and the coking products (black stain). Through this, the varnish potential of the sample can be measured and interpreted without interference from the coking products. After the power plant used an off-line filtration to clean the black particles, the insoluble MPC results improved a lot; however, the soluble MPC results still show varnish in the turbine oil. This implies that the oil is at its saturation point, and sooner or later, insoluble varnish might stick out again on the surfaces.
4. Conclusion and Recommendation
Today’s power plants face several lubrication oil related challenges. Therefore, the following are recommended:
-
Power plants should investigate the use of lubricating oil for the long-term economic benefits.
-
Unexpected turbine trips due to varnish are problems that can be resolved through routine monitoring of the lubricant properties, which includes combined soluble and insoluble MPC tests for varnish potential testing, in tandem with the improvement of contamination by using purification systems.
-
The synergistic effect of testing both soluble and insoluble MPC helps give more effective and accurate decisions: interferences are eliminated, and other root causes can be justified. The appropriate varnish removal technology can also be applied depending on the results of both soluble and insoluble MPC. These two tests combined give a more complete view of the varnish potential of the oil, rather than waiting until the varnish problems become severe.
5. Acknowledgment
This article contains excerpts from the original article published in the Journal of the Japan Institute of Energy 2022;101:12:242-250
https://doi.org/10.3775/jie.101.242
6. References
-
Andy Sitton.; Jo AmeyeNew Methods of Trending Varnish Buildup in Mineral Turbine OilLean ManufacturingReliability WorldLubrication Excellence2007
-
Peter Dufresne Jr.; Matthew G Hobbs.; Glen MaclnnisLubricant varnishing and mitigation strategiesCombined Cycle JournalFourth Quarter 2013pp. 34-402013
-
Service bulletin 6.0/110ETurbine Oil Analysis Information Solar TurbinesAug.2019
-
Siemens K-8962-1(Rev 10)In service monitoring of mineral turbine oils for gas and steam turbinesSiemens AGFeb. 172021
-
TIL 1528-3Lube Oil VarnishingGE Energy Services TechnologyNov. 182005
-
MHI lubricant listJune 122007
-
ASTM D7843-21Standard Test Method for Measurement of Lubricant Generated Insoluble Color Bodies in In-Service Turbine Oils using Membrane Patch ColorimetryAmerican Society for Testing and Materials052021
-
ASTM D445-21“Standard Test Method for Kinematic Viscosity of Transparent and Opaque Liquids (and Calculation of Dynamic Viscosity)American Society for Testing and Materials052021
-
ASTM D7414-18Standard Test Method for Condition Monitoring of Oxidation in In-Service Petroleum and Hydrocarbon Based Lubricant by Trend Analysis Using Fourier Transform Infrared (FT-IRSpectrometryAmerican Society for Testing and Materials052018
-
ASTM D6971-09(2014)Standard Test Method for Measurement of Hindered Phenolic and Aromatic Amine Antioxidant Content in Non-zine Turbine Oils by Linear Sweep VoltammetryAmerican Society for Testing and Materials052014
-
ASTM D974-21Standard Test Method for Acid and Base Number by Color-Indicator TitrationAmerican Society for Testing and Materials052021
-
ASTM D2272-14aStandard Test Method for Oxidation Stability of Steam Turbine Oils by Rotating Pressure VesselAmerican Society for Testing and Materials052014
-
ISO4406Hydraulic fluid power - Fluids – Method for coding the level of contamination by solid particlesInternational Standard2018
-
M.G. Hobbs.; P.T Dufresne Jr.Lubricant Varnishing and Varnish MitigationLubrication Maintenance and Tribotechnology2014
-
ASTM D4378-20Standard Practice for In-Service Monitoring of Mineral Turbine Oils for SteamGasand Combined Cycle TurbinesAmerican Society for Testing and Materials052020
-
Vincent J. Gatto.; William E. Moehle.; Tyler W. Cobb.; Emily R. Scheneller.The relationship between oxidation stability and antioxidant depletion in turbine oils formulated with Groups IIIII and IV base stocksJournal of Synthetic Lubrication J.Synthetic Lubrication200724:111-124
-
Ghasem ShilatiDeficiencies of patch colorimetry (MPCtest The Varnish Potential TestMachinery LubricationJanuary 1200https://www.machinerylubrication.com/Read/31929/patch-test.
