Monitoring Wind Turbine Gear Oils with Online Sensors

Introduction
We have known for decades that clean oil will improve system reliability and uptimeas well as prolong component and oil life in service [1]. This is especially top of mind for wind turbine owners and operators. Oil analysis is used to predict failure and hinder un-scheduled downtime. Howeverthe oil analysis mainly shows the status at the specific time of the sampleand it is difficult to ensure the sample is completely representative [2]. The oil cleanliness in a wind turbine gearbox (WTG) is hugely affected by loadidle or standstilland only sampling every six months makes trending even more inaccurate.
This is where online sensors show their value: they accurately monitor many times per hour and give immediate access to trending data. This article will evaluate oil cleanliness and the state of oil degradation/quality on 10 wind turbine gearboxes using online sensors.
Monitoring Oil Using Online Sensors
Online oil sensors give real-time data and help you predict a bad trendwhich could lead to a serious situation. The best online condition monitoring systems consider oil degradationwater content and particle count as well as machine load. In this paperwe will focus on particle counts and oil degradation/quality measured by resistivity since water issues are quite rare in wind turbine gear oil.
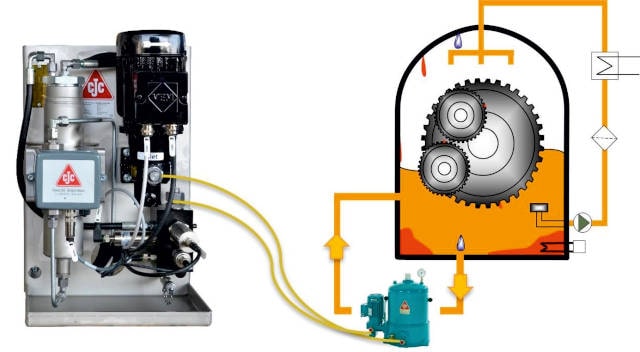
Obtaining the best possible installation point for the online sensors is vital to get the most representative data. Tests have shown that the offline/kidney loop oil filter circuit is ideal for online analysis due to the continuous homogeneous flow and suction from the bottom of the oil reservoir [3]. Optimum conditions are thereby present for the evaluation of particleswater and oil degradation.
Oil Degradation Sensors
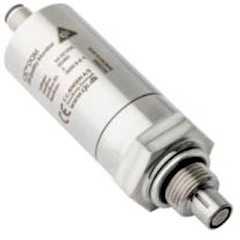
The oil quality or state of degradation can be evaluated using sensors that measure resistivitywhich correlates to oil aging by oxidationacidity and water content. Resistivity is well-known in the power industrywhere transformer oils have been monitored by resistivity for more than 5years [4].
A reduction in resistivity indicates the oil is degraded or contaminated. Resistivity sensors can thus be used to assess the oil quality/degradation and recommend actions such as sweeteningfiltration or a full oil change.
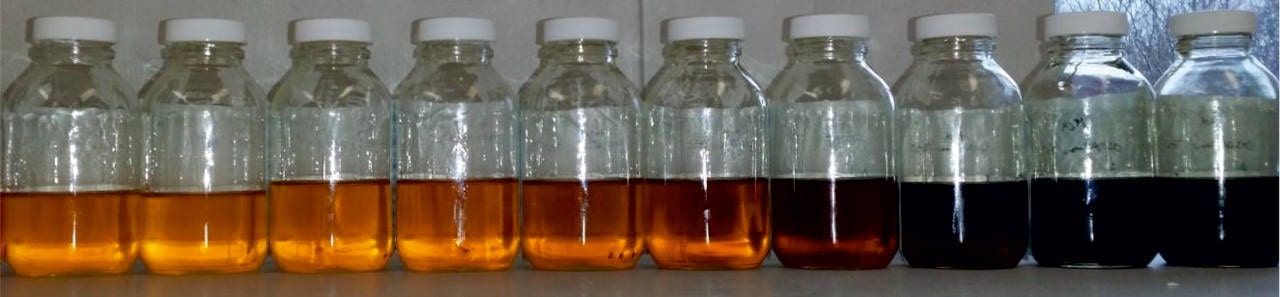
In gearboxesdegraded oil will often result in varnish and increased viscositywhich create problems like increased frictionpoor coolingetc. In additionthe oil may be difficult to pump during cold start-upswhich may lead to cavitation or even starvation. Oil degradation will reduce the oil’s in-service lifewhich will result in premature oil changesincreased gearbox wear and even risk of a complete failure.
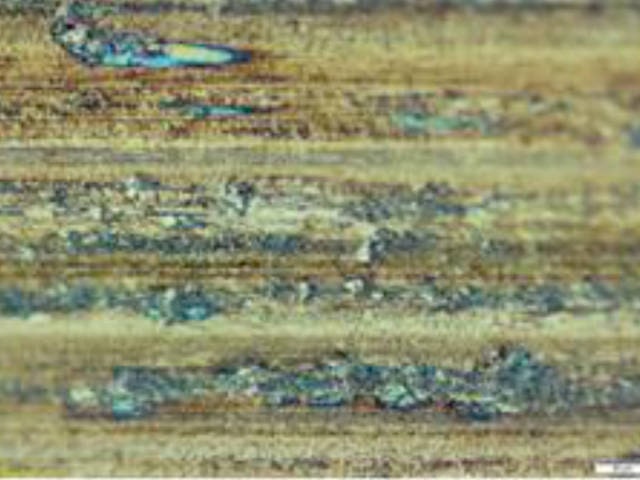
The photo below shows progressive states of oil degradation [5]which can be detected by means of reduced resistivity (online Oil Quality sensor).
Online Particle Counting
Particles will be created during the operation of any machineinfluenced by loadrotational speedoil temperatureoil additivesetc. [6]. But if the oil is kept mostly free from contaminantswear will be reduced to a minimum. Furthermoreit is much easier to discover an abnormal wear trend when the oil cleanliness is goodcompared to seeing an increase in particle counts in a very contaminated oil.
Benefits of Online Particle Counting
- Early warning: if the trend increasesa worn component can be replaced before larger issues arisee.g.replacing a ball bearing before a total breakdown of the gearbox.
- Oil analysis and maintenance can be scheduled according to the online datae.g.indicating a bad wear trendwhich requires an in-depth oil analysis or onsite investigation.
- Instant data access and visible trends can support more precise decision-making in case of overhaulsas well as improved maintenance practices and intervals.
Trending Data Using a Web-Based User Interface
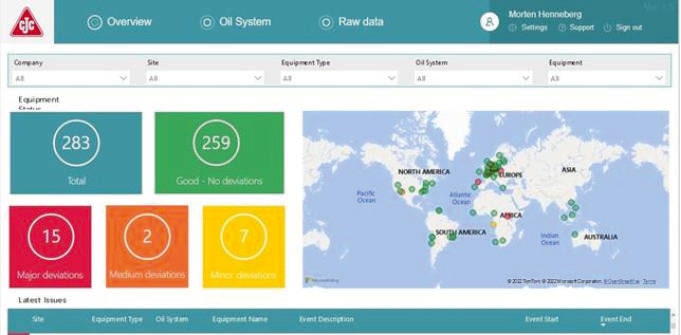
The data in this study is collected using C.C.JENSEN’s cloud solution (CJC® T2render) [7]which receives data from the CJC® Condition Monitoring Unit (CMU) [8]. The CMU can incorporate multiple sensorsbut in this studywe will focus on particle counts according to ISO 440as well as resistivityindicating the oil quality and state of degradation.
From the sensorsthe encrypted data are sent via a secure connection (4GWi-Fi or Ethernet) to a cloud-based solution for further analysis. The data can be provided directly to a surveillance system (SCADA system) or followed on a web-based user interface.
Alarms are sent to the operator by email or text message when pre-set limits are surpassed or when the individual system oil and equipment trend varies from normal operation. This reduces the complex and time-consuming interpretation of data from individual sensors from influencing each other.
Case Study — Monitoring Particles and Oil Quality/Degradation on 10 Wind Turbine Gearboxes
This study looks at data taken from 1WTGs installed in EuropeNorth America and South Americawith rated power from 0.MW to MW and a mix of on-shorenear-shore and off-shore installations.
Overview:
- 4 x SiemensMW (off-shore)
- 2 x Siemens2.MW (near-shore)
- 1 x Vestas V90MW (on-shore)
- 1 x GE1.MW (on-shore)
- 2 x NEG Micon0.MW (on-shore)
The 10 gearboxes were all fitted with a CJC® 3-micron offline/kidney loop oil filter for maintaining gear oil cleanliness. Some of the WTGs had the 3-micron offline filter (OEM fitted)and some had the filter retrofitted later in the WTG’s life.
During the operation of a gearboxany changes in loadstart/stoptemperaturewind gusts or other stress factors will create particles visible to the online particle counter. Smaller particlesup to 1microns in sizeare seen during normal abrasive wear (and 6-micron counts in the ISO 440codes)while particles larger than 1microns indicate severe wearfatigue or adhesion (14-micron and larger in the ISO 440codes).

It isthereforeof the utmost importance to ensure that additional particles created during stress/load changes are removed as quickly as possible to limit the time in which they can damage gearspumpsbearingsetc. — anywhere with an ultra-thin oil film clearances less than microns. A particle wedged between moving surfaces creates hundreds of new particlessending the wear in an increasingly vicious spiral.
An increase in the number of 14-micron and larger particles indicates an ”out of normal” operationwith possible severe abrasionadhesion or fatigue propagation.

Testing of particle distribution in used oil (Figures 6-9) shows that normal abrasive wear results in exponentially distributed particles with close to no particles of size 1µm or above. Microscope inspection of the worn surface support wear scars below µm.
When fatigue wear modes are investigatedthe distribution curve changes and particles larger than 1µm are detected in greater quantities. This is also supported by the visual surface damages that range from 5µm to 100+ µm in diameter.
It is essential that the oil filters can keep up with the particles generated during operation. If the filters cannotthen the oil will get progressively more contaminatedresulting in reduced component and oil life.
The particle counts on WTG oils with a 3-micron CJC® offline filter installed are typically ISO 15/13/1according to ISO 440(see test results Figure 10).
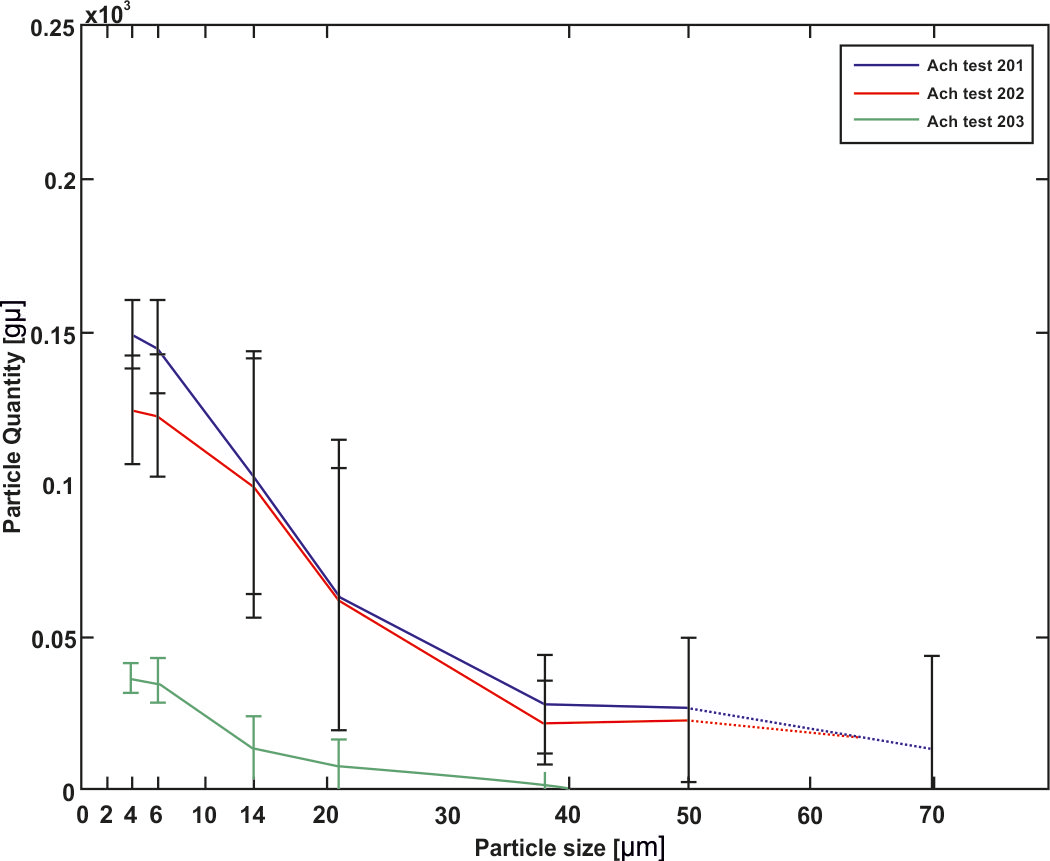
Figure 10: Typical particle counts on WTGs with 3-micron CJC® offline filters (bottle sampling).
| Number of particles per 100 ml | ||
|---|---|---|
| Over | Up to | Purity class |
| 4,000,000 | 8,000,000 | 24 |
| 2,000,000 | 4,000,000 | 23 |
| 1,000,000 | 2,000,000 | 22 |
| 500,000 | 1,000,000 | 21 |
| 250,000 | 500,000 | 20 |
| 130,000 | 250,000 | 19 |
| 64,000 | 130,000 | 18 |
| 32,000 | 64,000 | 17 |
| 16,000 | 32,000 | 16 |
| 8,000 | 16,000 | 15 |
| 4,000 | 8,000 | 14 |
| 2,000 | 4,000 | 13 |
| 1,000 | 2,000 | 12 |
| 500 | 1,000 | 11 |
| 250 | 500 | 10 |
| 130 | 250 | 9 |
| 64 | 130 | 8 |
| 1.1 | 64 | 7 |
| 32 | 1.1 | 6 |
| 16 | 32 | 5 |
| 8 | 16 | 4 |
| 4 | 8 | 3 |
| 2 | 4 | 2 |
| 1 | 2 | 1 |
Particle counters typically use optical light extinction sensors [11]as do the online sensors in this study. The particle counts detect particles bigger or equal to micronsbigger or equal to microns and bigger or equal to 1microns. The counts are converted into ISO codes/classes according to the ISO 440table (see Figure 11).
The online particle counters used in this study are Oil Contamination Monitors (OCMs)[12]which measure the particle counts for five minutesaverages themand converts them into ISO codes; the cycle then repeats.
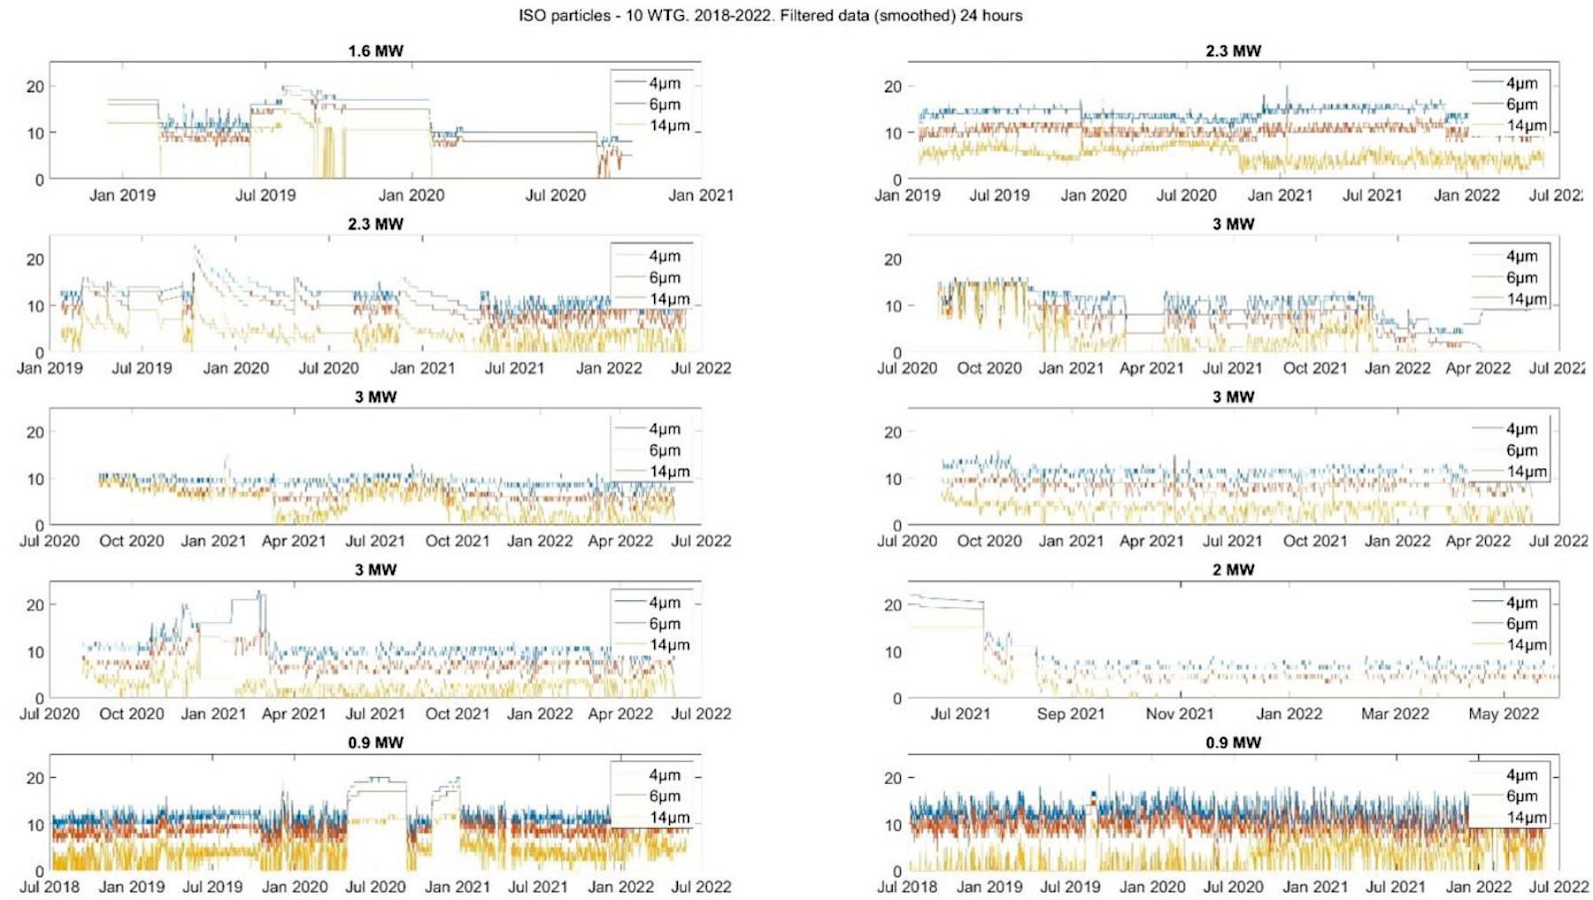
It is possible to see the ISO code trend as raw data or to smoothen data out over a 24-hour period.
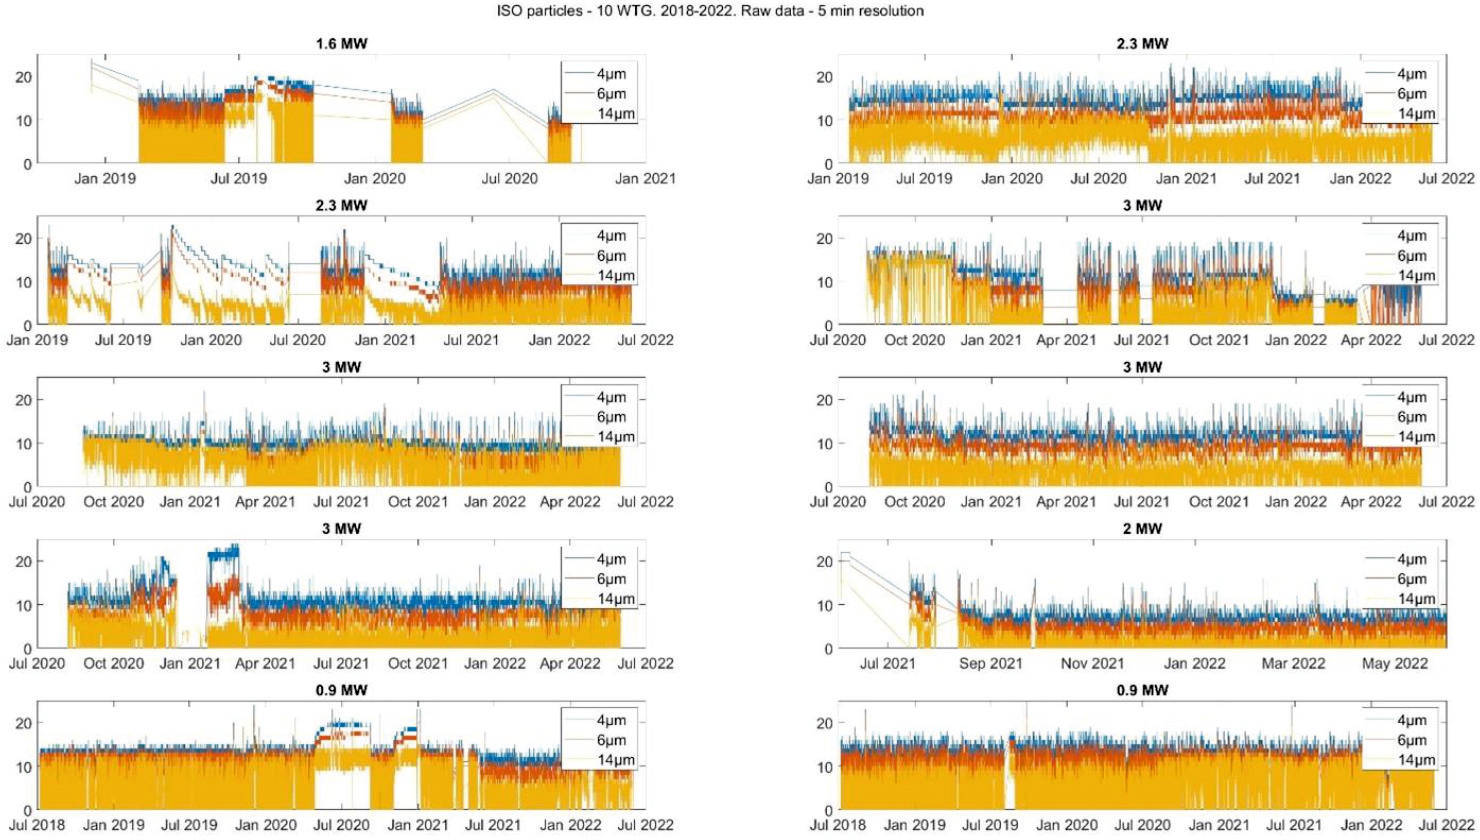
Looking at raw data over a long periodsay four yearswill impair the opportunity to see a trendbut averaging the ISO code raw data into 2hours enables us to see the trend more easily.
|
Analysis Results |
Current Sample | 11 previous samples not shown | |||
|---|---|---|---|---|---|
| Lab Number | 2966908 | 2783652 | 2634838 | 2590081 | |
| Sample Rating | ✓ | ✓ | ✓ | ✓ | |
| Date tested | 03.11.2015 | 07.04.2015 | 13.10.2014 | 03.03.2014 | |
| Date of sample taken | 26.10.2015 | 30.03.2015 | 07.10.2014 | 21.02.2014 | |
| Date of last oil change | 21.05.2008 | – | – | – | |
| Top-up since change | – | – | – | – | |
| Operating time since change | – | – | – | – | |
| Total operating time | 120940 | 115949 | 111806 | 106467 | |
| Oil changed | – | – | no | no | |
| Additional Tests | |||||
| AN/NN | mgKOH/g | 0.92 | 0.89 | 0.94 | 1.07 |
| Cleanliness class | ISO 4406 (1999) | 15/13/10 | 15/13/10 | 18/17/14 | 15/13/11 |
| A: >4pm = ISO >4pm | Particles/100ml | 18379 | 21297 | 236423 | 20047 |
| B: >6pm = ISO >6pm | Particles/100ml | 4810 | 6879 | 85784 | 4174 |
| C: >14pm = ISO >14pm | Particles/100ml | 556 | 856 | 9522 | 1652 |
| D: >21pm | Particles/100ml | 140 | 182 | 2267 | 300 |
| E: >38pm | Particles/100ml | 0 | 39 | 151 | 0 |
| F: >70pm | Particles/100ml | 0 | 0 | 0 | 0 |
| Cleanliness class | SAE AS 4059 | 5A | 5A | 9A | 5A |

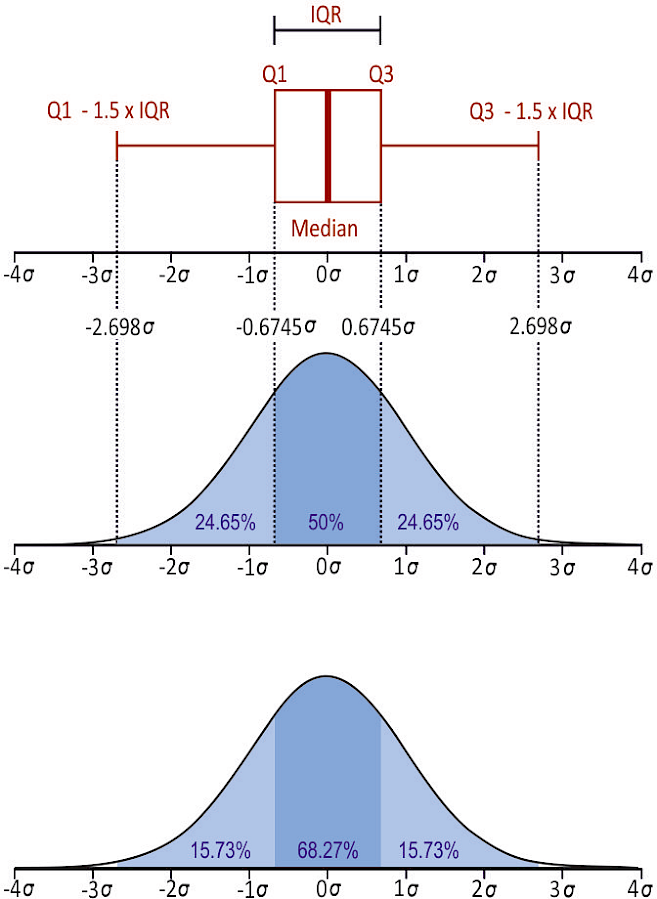
Applying the Box Plot
A box plot model can be used to average the ISO codes over four years.
Here the meridian is indicated by the red lineand 5percent of all data are in the blue boxwhile 99.percent of all data are within the whiskers indicated by black lines. Red points indicate outliers — measurements larger/smaller than 99.percent of the data.
Applying the box plot model to ISO codes (4and 14-micron particles) for the 1WTGs in this study:
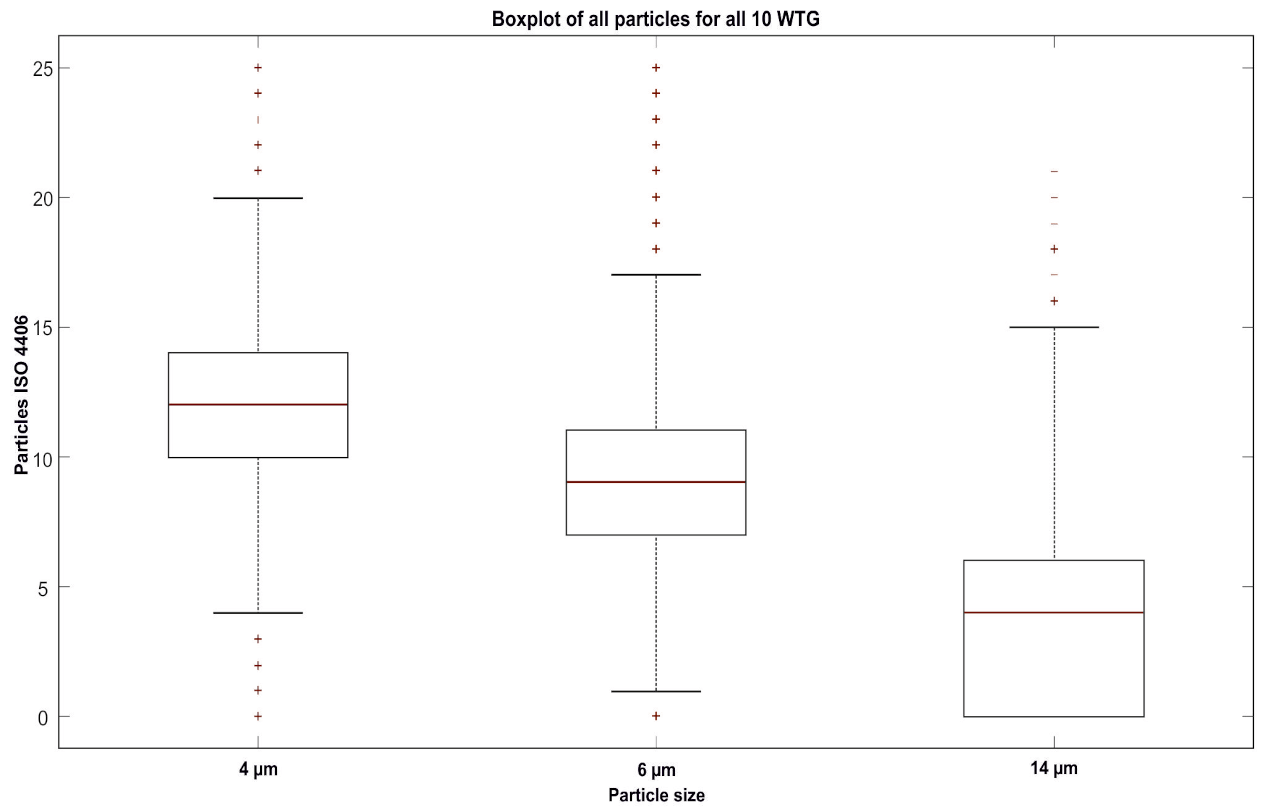
The wind turbine gear oils in this study arein generalall super cleanwith very few particles larger than 1micronsmeaning no indication of abnormal wear. The “normal” ISO codes for these 1healthy WTGs sums up to be:
5percent of the data are in the box from ISO code 10/7/up to ISO 14/11/6.
(ISO code equals only 32-6particles in 10mL oil.)
99.percent of the data are within the whiskers from ISO code 4/1/to 20/14/15.
Alternativelythis can be written as: ISO 12/9/+/-(5% of data) and ISO 12/9/+/- (99.% of data).
Evaluating the 1Wind Turbine Gear Oils in Terms of Oil Degradation
The same 1wind turbine gearboxes were also fitted with online oil quality sensorsCJC® Oil Quality Monitors (OQMs)to evaluate the degradation state of the oils by means of resistivity.
All WTGs were using fully synthetic PAO-based oilsISO VG 320from well-known oil manufacturers (CastrolMobilFuchs and AMSOIL)which were anonymized in this study as oil types to 5. The in-service life varies from three to more than 1yearswith two of the oils having an unknown age.
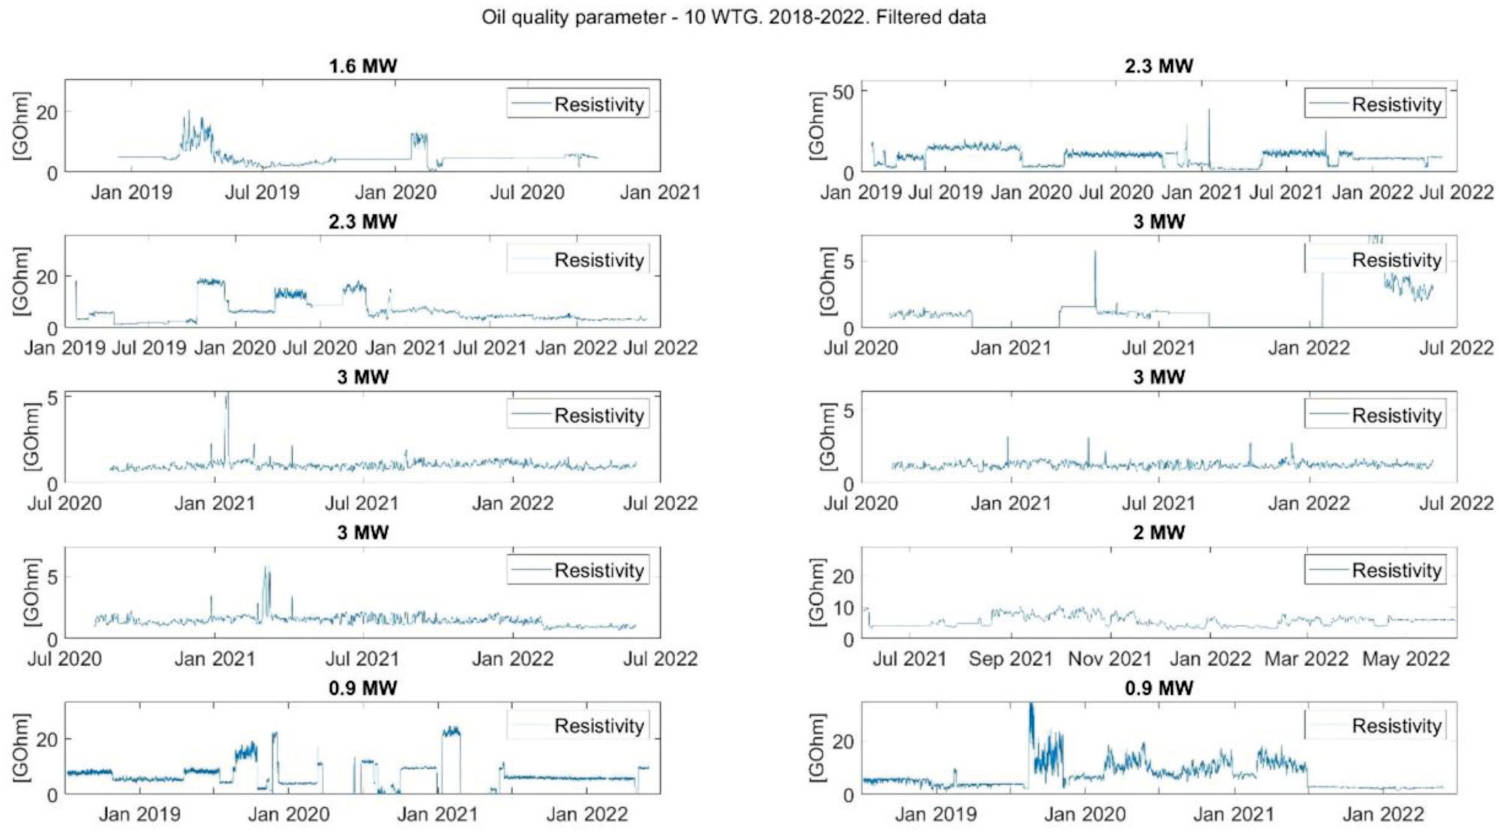
WTGs to are using the same oil type — type — but with different in-service lives. WTGs and are also using the same oil type — type — but at different ages.
The oil degradation/quality is monitored online every five minutes by the OQM sensors (resistivity). In the following illustrationthe online data during the three years (2019-2022) are smoothened out over 24-hour periods:
Applying the box plot model to the resistivity data on the 1WTGs reveals a drop for oil type comparing the six-year-old to the 13+ years in service oils (WTGs number and 9)but doesn’t show a severe drop in resistivityso both oils are well maintained and don’t need to be replaced.
The five WTGs (numbers to 8)which were using the same oil type (4)showed an even clearer picture of oil degradation/quality between the three-year-old and nine years in service oils.
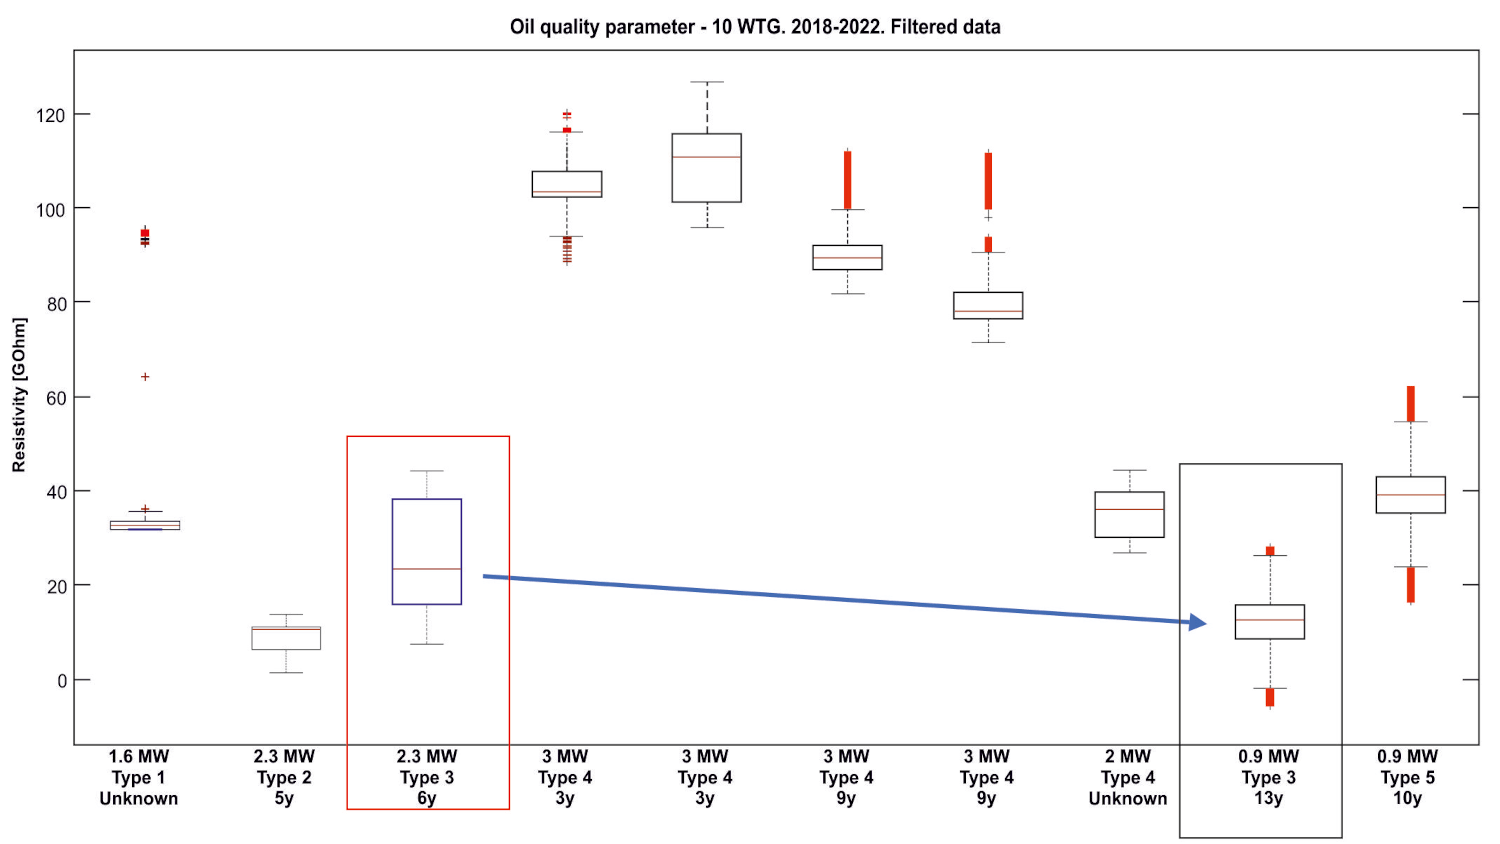
Unfortunatelythe age of the oil type was unknown on WTG number 8but since the resistivity has decreased so muchit is likely that the oil has been in service for many yearspossibly more than 1years.
If notthen the oil has been poorly maintained and very contaminated most of its life prior to the offline filter installation.

Conclusion
The uptime of wind turbines depends on an efficient gearbox with clean oil. An offline oil filter (kidney loop) is operating continuously and should be able to remove the majority of newly generated particles. The CJC® offline oil filter has a very stable and consistent filtration efficiency and is able to keep up with particle generationmaintaining the WTG oil cleandry and varnish-free. This has been proven for decades in more than 135,00wind turbines worldwideutilizing CJC® offline oil filters on gearboxes.
| WTG no. | WTG output | Oil type (anonymous) | In-service life (years) |
|---|---|---|---|
| 1 | 1.6 MW | Type 1 | Unknown |
| 2 | 2.3 MW | Type 2 | 5+ |
| 3 | 2.3 MW | Type 3 | 6+ |
| 4 | 3.6 MW | Type 4 | 3+ |
| 5 | 3.6 MW | Type 4 | 3+ |
| 6 | 3.6 MW | Type 4 | 9+ |
| 7 | 3.6 MW | Type 4 | 9+ |
| 8 | 2.0 MW | Type 4 | unknown |
| 9 | 0.9 MW | Type 3 | 13+ |
| 10 | 0.9 MW | Type 5 | 10+ |
Learning Points From the Study
Regarding oil cleanliness in terms of particle counting:
- Healthy wind turbine gearboxes with well-filtered oil operate at around ISO 12/9/(+/-2)
- Trending on small (4-µm) particles will give insights to:
- Abnormal abrasive wear
- Abnormal operation of the filtration system and possible faults
- Trending on larger (14-4µm) particles can give insight to:
- Severe abrasion/fatigue/adhesive wear
In terms of oil degradation/quality monitored by resistivitythe study shows:
- The state of oil degradation and aging can be trended
- Different oil types/brands have different levels of resistivityso a sudden change could indicate wrong oil has been added
- Monitoring the oil resistivity trend can give insights to:
- Stability of the oil quality and state of degradation (possibly reduce oil sampling intervals)
- Remaining useful life of the oil in service
If you want to improve the power factor of your wind turbineit is best done by keeping the oil clean using a combination of good air breathersin-line oil filters and offline/kidney loop depth filters while monitoring and trending the oil cleanliness and state of degradation/quality.
Benefits When Improving Cleanliness and Monitoring the Oil for Particles and Oil Degradation/Quality:
- Increased operational reliability due to less component wear and better oil conditions
- Extended oil and machine component life due to less degradation
- Reduced oil consumptionresulting in savings and lower environmental impact (COreduction)
- Less downtimesince problems can be foreseen and maintenance scheduled according to the data trend and wear situation
- Detection of abnormal operationhelping to find root causes more easily
- Detection of changes in oil qualitye.g.wrong oil addedwhich could cause foaming or short oil life
- Detection of abnormal wear. Replacing worn components proactively before a major breakdown occurs will yield large savings
Offline oil filters and online monitoring equipment do include initial costs but will result in large savings on the maintenance budgetplus an increase in the uptime and power factor for the wind turbine — offering a competitive advantage.
Online monitoring also adds additional safety and makes data trends readily available for interpretation.
References:
-
R.S. Sayles, P.B. Macpherson, Influence of wear debris on rolling contact fatigueRolling contact fatigue testing of bearing steels. A symposium sponsored by ASTM committee A-on steelstainless steeland related alloysASTM STP 77(1982) 255–274.
-
TormosB. (2013). Engine Condition Monitoring Based on Oil Analysis. In: WangQ.J.ChungYW. (eds) Encyclopedia of Tribology. SpringerBostonMA. https://doi.org/10.1007/978-0-387-92897-5_1149
-
Henneberg M, Jørgensen B., Eriksen R. L. Oil condition monitoring of gears onboard ships using a regression approach for multivariate Tcontrol charts; Journal of Process Control 4(2016) 1–1http://dx.doi.org/10.1016/j.jprocont.2016.07.001
-
Corugedo Alexander & Pérez BarcalaBeatriz & MonteroYosmari. The Electrochemical Impedance Spectroscopy as a Diagnostic Tool of the Transformer Oil. Revista Cubana de Ingeniería. 5. 10.1234/rci.v5i3.288.
-
Henneberg M. A method for Controlled Oxidation of Lube and Hydraulic
Oils and Investigation of the Effects on Oil Parameters ; Oildoc2015January 27-29(Proceedings)RosenheimGermany. -
Wei Cao, Han Zhang, Ning Wang, Hai Wen Wang, Zhong Xiao Peng. The gearbox wears state monitoring and evaluation based on on-line wear debris featuresWearVolumes 426–427Part B2019Pages 1719-1728ISSN 0043-1648https://doi.org/10.1016/j.wear.2018.12.068.
-
https://www.cjc.dk/products/t2render/accessed 19-08-2022
-
C.C.JENSEN A/S. Condition Monitoring Unit CMUAdvanced oil sensor system
Product Sheet. 2020. url: https://www.cjc.dk/fileadmin/root/File _
Admin_Filter/doc_Product_sheets/Monitoring_Equipment/ConditionMonitoring-Unit-CMU_PSMO4009UK.pdf. -
Henneberg, M. Eriksen R. L. Tribological test and optical measurements of particles and their distribution as function of wear mode; Oildoc2017January 24-26th(Proceedings)Rosenheim Germany
-
https://www.cjc.dk/products/fine-filters/hdu-27/accessed 19-08-2022
-
KrogsøeK.; HennebergM.; EriksenR.L. Model of a Light Extinction Sensor for Assessing Wear Particle Distribution in a Lubricated Oil System. Sensors 2018184091. https://doi.org/10.3390/s18124091
-
https://www.cjc.dk/products/monitoring-equip/sensor-package/oil-contamination-monitor-ocm15-advanced-online-particle-counter/accessed 19-08-2022
Illustrations:
- illustration 1: Wind turbines in the ocean stock photo. iStock-1312167454.jpg
- illustration through 912-13plus 15-20: C.C.JENSEN,
- Illustration 14: Box plot model explained. https://en.wikipedia.org/wiki/Box_plot
- illustration 10-11: Oelcheck GmbH
For more information about CJC® offline oil filter systemsplease visit C.C.JENSEN’s main website www.cjc.dk