
Used Oil Re-Refining: Why Mass Balance Is the Real Measure of Recovery Efficiency
Track every material stream to distinguish gross recovery from qualified product and economic recovery.
Beyond Recovery Percentage - Understanding Where Every Kilogram of Feedstock Actually Goes
Introduction
Engineers often evaluate used-oil re-refining with one simple question: “What percentage of oil was recovered?” At first glance, this value appears to measure process efficiency cleanly. However, in practical re-refining engineering, recovery percentage alone can deceive.
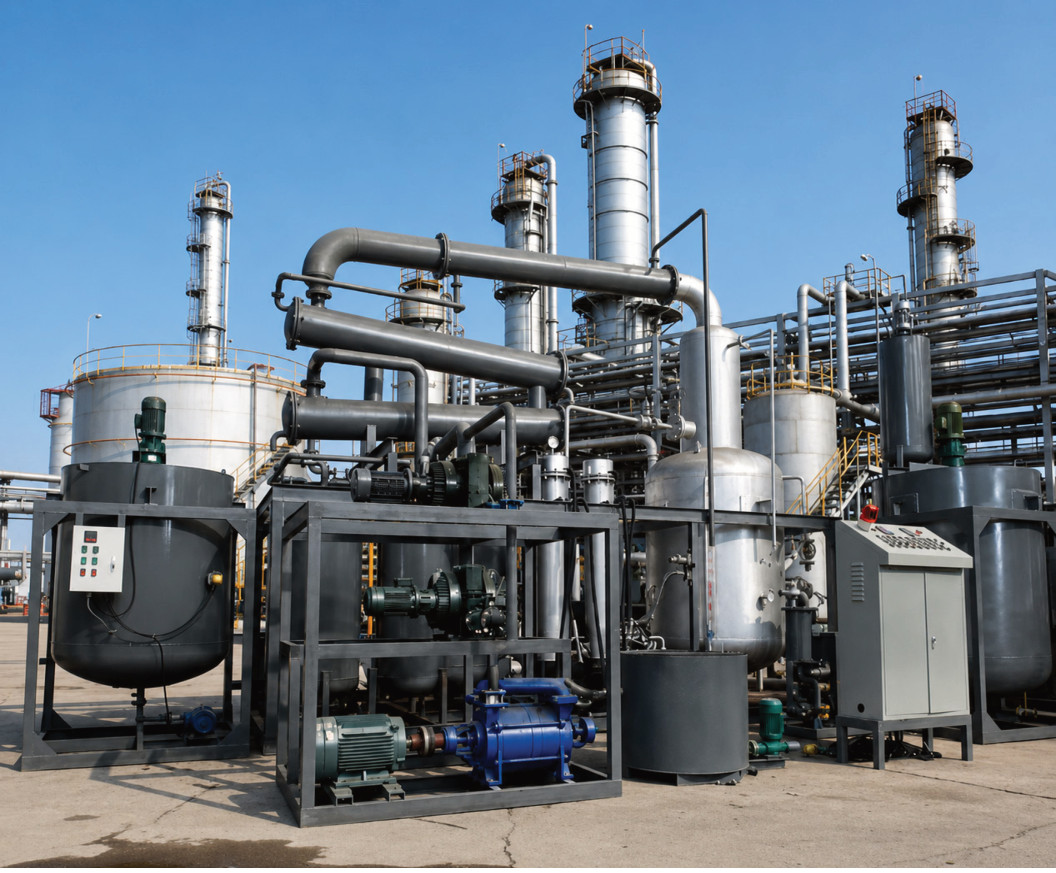
A plant may report a high recovery yield while part of the recovered material still requires treatment, reprocessing, blending, filtration, or quality correction. Some material may ultimately become a lower-value stream rather than a qualified product.
The fundamental engineering question remains: Where did every kilogram of incoming used-oil feedstock actually go?
This context makes mass balance an essential engineering tool for evaluating a re-refining process. Recovery indicates how much material is recovered. Mass balance proves what actually happened to the material.
The Engineering Question
Consider a plant that receives 1,000 kg of used oil and reports 850 kg of recovered oil. The immediate reaction might be: “85% recovery - excellent.”
However, engineers must ask follow-up questions:
- Where did the remaining 150 kg go?
- How much was water, light material, sludge, or heavy residue?
- How much was lost during filtration or handling?
- How much remained inside equipment and pipelines?
- Most importantly, how much of the 850 kg met product specifications, and how much required reprocessing or blending?
Only answering these questions reveals true recovery performance.
What Is a Mass Balance in Used-Oil Re-Refining?
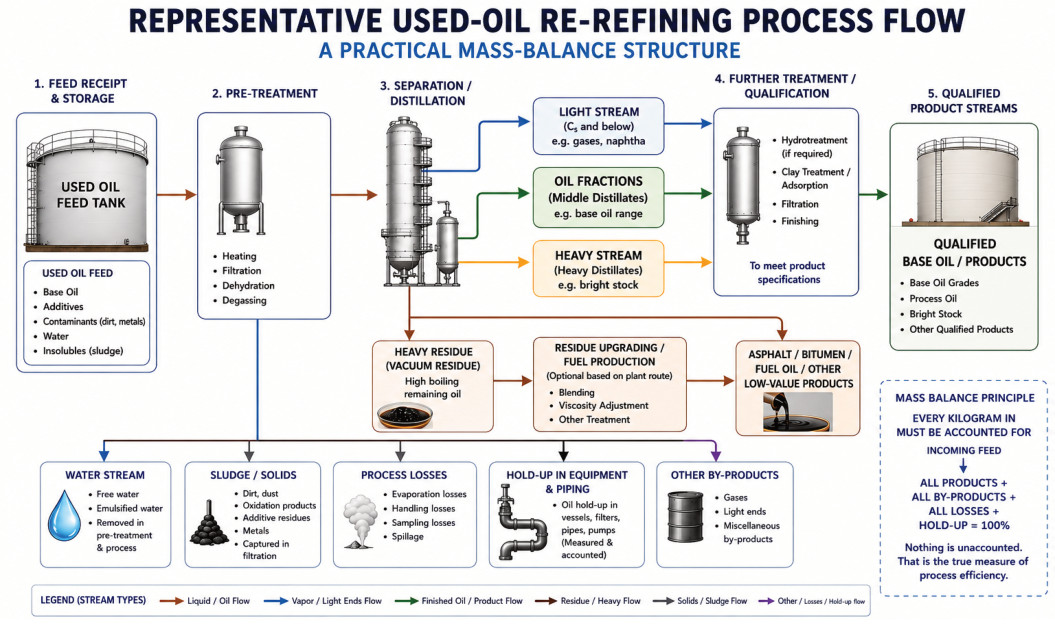
In re-refining, material enters the plant, passes through processing stages, changes composition, and exits through product, by-product, residue, or loss streams. A mass balance systematically accounts for these material flows.
Used-oil re-refining requires this rigor because incoming feed is not a single pure material. It can contain oil, water, light hydrocarbons, additives, degradation products, solids, metals, and other contaminants.
Therefore, a meaningful mass balance cannot stop at “Feed in = Base oil out.” Engineers must ask: “Feed in = which streams out, in what quantities, and with what composition?”
Typical streams include:
- Water/aqueous material
- Light fractions
- Recoverable lubricating-oil fractions
- Heavy fractions or residues
- Sludge/solids
- Filtration-related losses
- Accountable process losses
- System hold-up or inventory changes
Gross Recovery, Qualified Recovery, and Economic Recovery
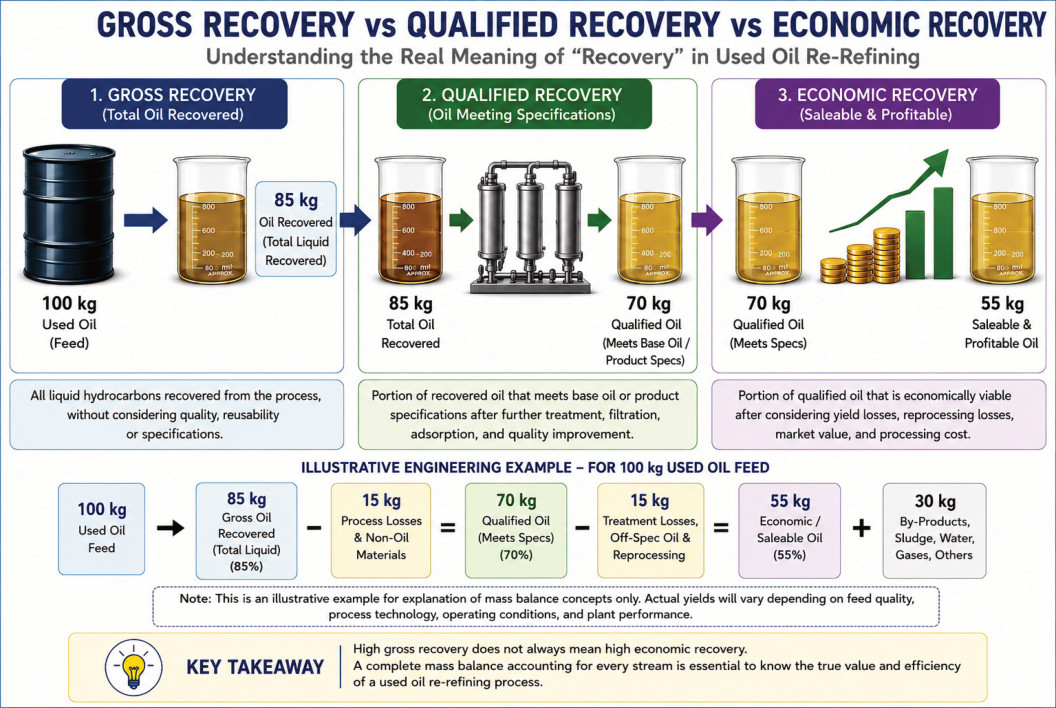
A recovery percentage can look impressive without presenting the complete performance story. Engineers must separate three distinct metrics:
- Gross recovery measures how much material was recovered relative to incoming feed. It provides a useful first-level indication, but does not establish product quality or economic value.
- Qualified recovery measures how much recovered material met defined product-quality requirements after treatment and quality-control steps. A stream may be physically recovered but still require treatment, blending, reprocessing, or downgrading.
- Economic recovery evaluates the financial value of qualified products and by-products relative to the feedstock and processing resources required.
High gross recovery does not ensure high qualified recovery, and high qualified recovery does not guarantee high economic recovery.
A Simple Engineering Example
Suppose feedstock totals 1,000 kg and reported recovered material equals 850 kg, yielding an 85% gross recovery.
Concluding that the plant achieved 85% successful product recovery at this stage is premature. If portions of the 850 kg require reprocessing, blending, or downgrading, final qualified product yield falls below headline recovery.
The engineering evaluation must trace material beyond the first recovery point:
Feed —> Recovered Material —> Treated Material —> Qualified Product —> Saleable Value
Apply this same principle to non-product streams. Identify and account for water, sludge, residue, light fractions, and system hold-up rather than grouping them into an unexplained “process loss” figure.
Building a Complete Stream-by-Stream Mass Balance
After separating gross, qualified, and economic recovery, construct a complete stream-by-stream material account.
First, establish the system boundary. The boundary may cover the entire plant, a process section, a separation unit, a treatment stage, or another defined operation.
The core engineering relationship is:
TOTAL INPUT = TOTAL OUTPUT + ACCUMULATION
Or, expressed for practical operation:
INPUT = PRODUCTS + BY-PRODUCTS + RESIDUES + LOSSES + CHANGE IN INVENTORY
For each significant stream, record quantity, measurement method, accounting batch, destination, quality status, and cross-check availability against independent records.
A mass balance depends entirely on measurement reliability. Support feed quantities with a calibrated weighing or documented measurement system. Account separately for water, light material, recovered oil fractions, heavy residues, and solids whenever practical. Include equipment system hold-up and opening/closing inventory.
Express the final balance on one consistent mass basis. Do not mix volume and mass without a documented conversion basis.
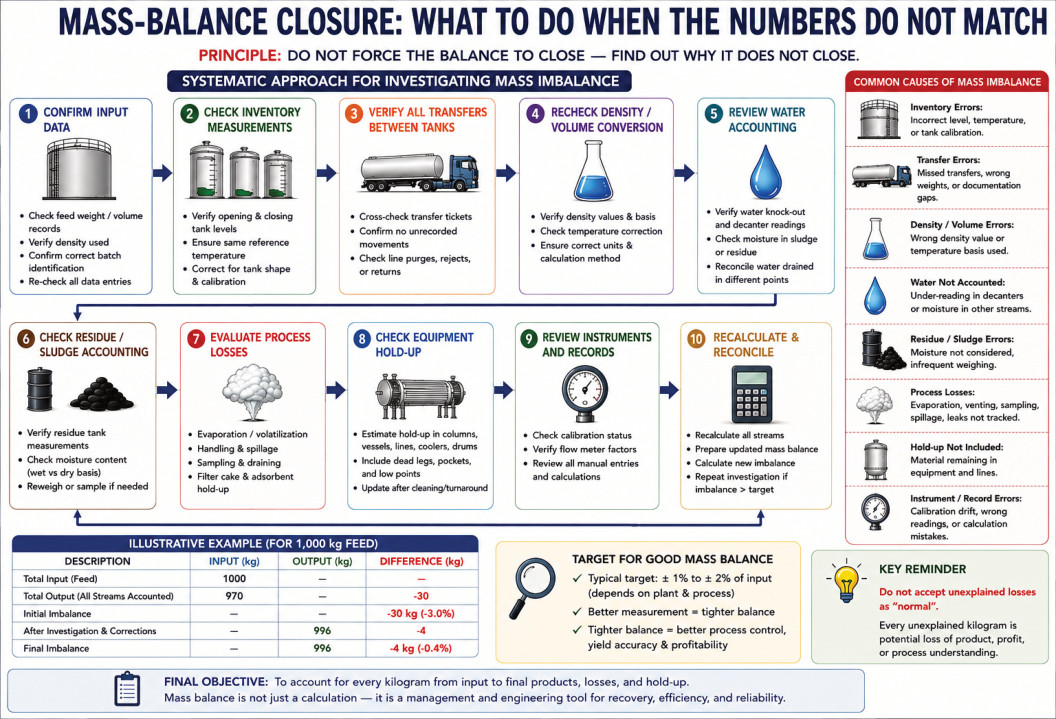
When the Balance Does Not Close
A mass balance is not complete simply because a spreadsheet produces a total. Determine whether the difference between input and accounted output is acceptable, explainable, and supported by your measurement basis.
Mass Difference = Total Input − Total Accounted Output
Balance Difference (%) = (Mass Difference ÷ Total Input) × 100
For example, if input feed is 1,000 kg and output streams total 985 kg, the initial difference is 15 kg (1.5%).
Do not immediately label this 15 kg as “process loss.” First review inventory changes, water measurements, residues, transfer records, density conversions, sampling, instrument calibration, and system hold-up. Classify only the remaining unaligned portion according to your documented accounting basis.
Forcing mass balance closure by assigning unexplained differences to “process loss” compromises data integrity. A credible mass balance does not artificially force numbers to match; it clarifies, justifies, and documents the remaining difference.
From Recovered Oil to Qualified Product
Recovering an oil-containing stream differs from producing a qualified finished product. A recovered stream may require further separation, treatment, filtration, polishing, blending, or quality control before meeting application specifications.
A qualification-based material account must trace recovered streams through treatment, quality evaluation, qualified product status, alternate grades, reprocessing, or residue disposition.
For example, given 1,000 kg of used-oil feed, suppose recovered streams total 850 kg, but only 700 kg meets qualified product standards. Identify the disposition of the remaining 150 kg - such as reprocessing, blending, alternate product streams, or residue - rather than omitting it.
This method connects process yield to product quality and explains why processes with identical gross recovery yield different quantities of qualified product.
Batch-Wise Mass Balance as a Diagnostic Tool
A batch-wise mass balance simplifies engineering analysis by tying every stream to the same defined feed quantity and accounting period.
Applying this accounting structure consistently allows engineers to track feed quality, stream distribution, gross recovery, qualified-product yield, residue generation, and balance closure trends. Repeated variance in mass balance closure serves as an active plant diagnostic signal. Recurring differences often expose measurement weaknesses, inventory tracking issues, unmeasured streams, or physical process losses.
Consequently, mass balance shifts from a routine reporting exercise into an operational tool for process troubleshooting and performance optimization.
Conclusion
Recovery percentage serves as a helpful indicator, but cannot stand as the sole metric for re-refining efficiency.
A rigorous engineering evaluation tracks every kilogram of feedstock. It determines recovered quantities and qualified product yields, by-product streams, physical losses, system hold-up, inventory changes, and final reconciliation.
The core principle remains clear:
A high recovery number does not equal a high-quality recovery outcome.
Mass balance establishes the precise framework for tracking material from feedstock to final disposition. Integrating recovery, qualification, and material accounting makes re-refining performance transparent, comparable, and technically actionable.
About the Author

Prem Raj is an Industrial Lubrication Consultant with 30+ years of practical experience in lubricants, greases, lubrication engineering, oil analysis, reliability, and used-oil re-refining. His work bridges field operations with engineering problem-solving, technical education, and industrial decision-making.
Keep reading